


Precision Drilling Corporation (PDS:NYSE) vs Superior Energy Services, Inc. (SPN:NYSE)
Profit of $925.30 in 48 calendar days on $10,000/leg. 28% return on CFD margin (6:1 leverage)
Summary Profiles (Source: Yahoo! Finance, Company websites)
![]()
Precision Drilling Corporation provides oil and natural gas drilling and related services and products. The company operates in two segments, Contract Drilling Services, and Completion and Production Services. The Contract Drilling Services segment offers onshore well drilling services to exploration and production companies in the oil and natural gas industry. As of December 31, 2016, this segment operated 255 land drilling rigs, including 135 in Canada; 103 in the United States et. al. The Completion and Production Services segment offers completion and workover services, and ancillary services to oil and natural gas exploration and production companies. This segment also engages in the rental of oilfield surface equipment, and wellsite accommodations. Precision Drilling Corporation was founded in 1951 and is headquartered in Calgary, Canada.
![]()
Superior Energy Services, Inc. provides oilfield services and equipment to oil and natural gas exploration and production companies in the United States, the Gulf of Mexico, and internationally. The company operates in four segments: Drilling Products and Services, Onshore Completion and Workover Services, Production Services, and Technical Solutions. Superior Energy Services, Inc. was founded in 1991 and is headquartered in Houston, Texas.
|
||||||||||||||||||||||||||||||||||||||||||||||||||||||||||||||||||||||||||||||||||||||||||||||||||||||||||||||||||||||||||||||||||||||||||||||||
Current Three-Year Backtest Using PairTrade Finder PRO Top 30 Settings
(Yahoo! Finance Historic API datafeed)
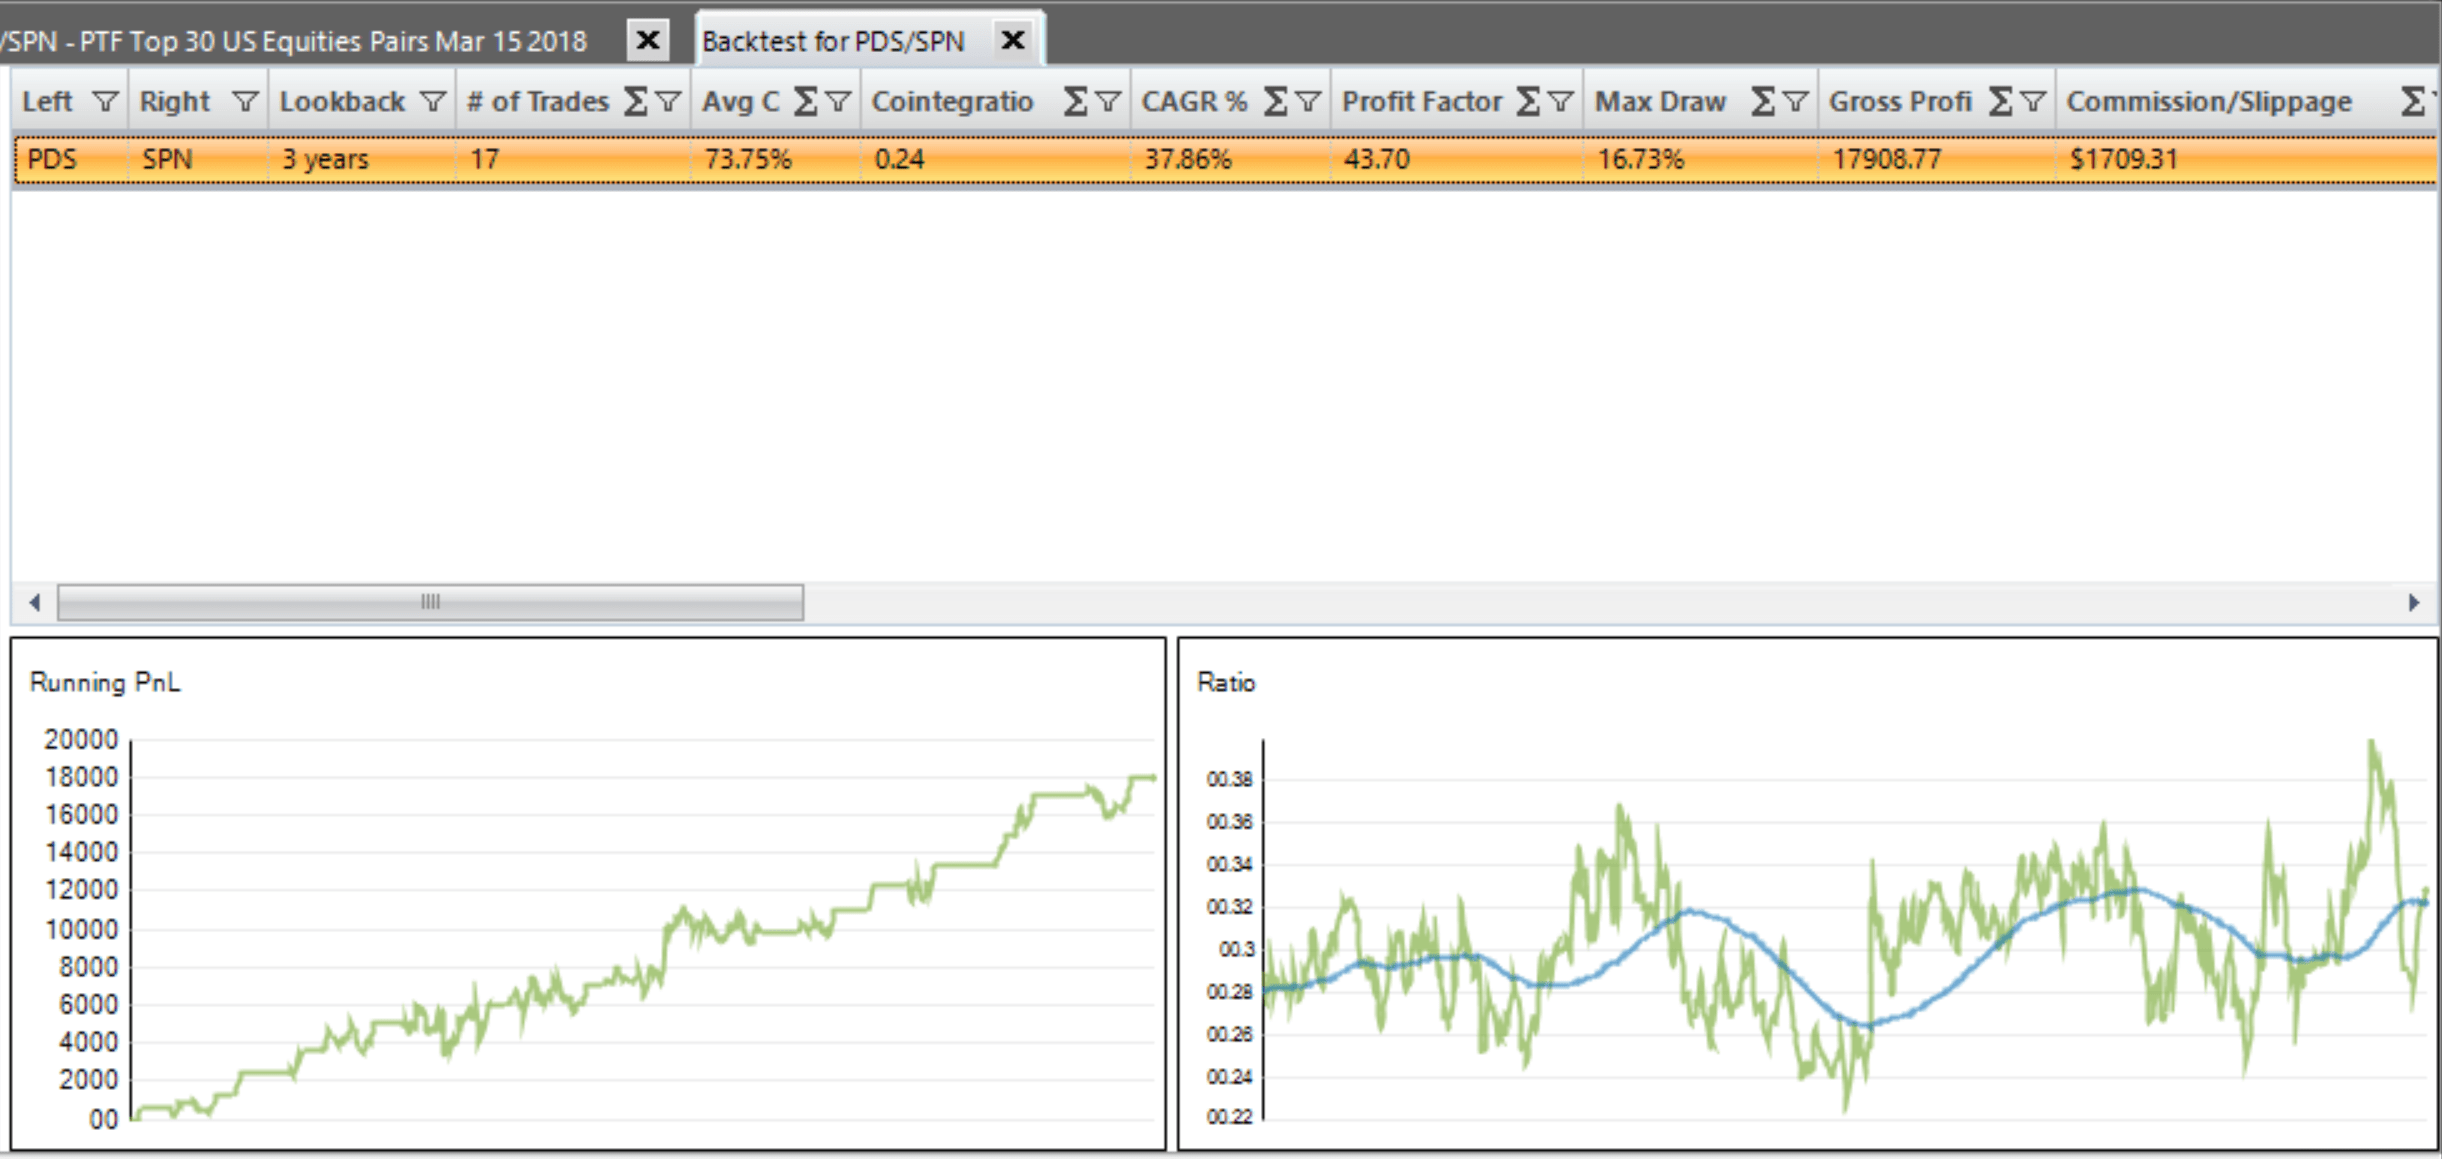
17 trades in 3 years. Avg. Correlation 74%, Cointegration 0.24 (low), CAGR 38%, Max DD 17%, Percent of Winning Trades 88%, Avg. Net Profit per Trade $953. Average Days in Trade 26 days. Great equity curve in the last 12 months. Good ratio line, lots of back and forth. Besides the low cointegration, pair looks excellent.
PDS/SPN Relative Performance Last 12 Months
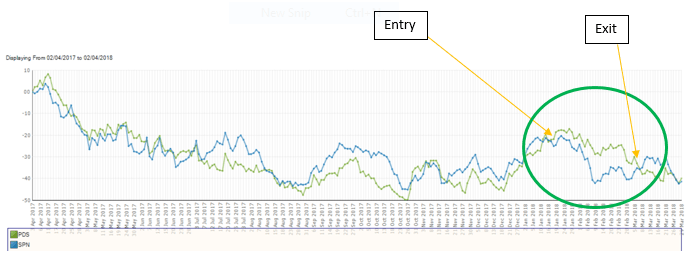
Entry Trade Signal EOD 19 January 2018 at -2.17 sd (IQFeed):
![]()
Short Leg: Sell Short 2673 shares of PDS at $3.75 = $9,998.69
Long Leg: Buy Long 921 shares of SPN at $10.82 = $9,990.13
Check News:
PDS – On 15 January 2018 PDS announced an updated investor presentation with revised guidance, this was three full trading days before the 19 Jan 2018 EOD signal. Stock was pretty much unchanged. Likely the impact of the presentation was priced in by then. No other news impacting fundamentals in the 10 days prior to the Entry Signal.
SPN – ON 19 January 2018 (signal date) SPN announced that its Q4 2017 results presentation would take place one month hence (no fundamental impact). No other fundamental value affecting news in the 10 days prior to the EOD 19 Jan 2018 Entry Signal.
Check Earnings Announcements & Dividends:
PDS:
15 Feb 2018: Q4 2017 Earnings Announcement
PDS did not pay a dividend in 2016 and 2017, none announced for 2018.
- Results announcement of 15 Feb 2018 is 26 days hence from Entry signal. Average trade length for PDS/SPN has been 26 days. We would consider this an acceptable window to have a mean reversion, however, every trader must have their own trading rule on this point.
SPN:
19 Feb 2018: Q4 2017 Earnings Announcement
SPN has not paid a quarterly dividend since Q1 2016, none announced for 2018.
- Results announcement of 19 Feb 2018 is 30 days hence from Entry signal. Average trade length for PDS/SPN has been 26 days. We would consider this an acceptable window to have a mean reversion, however, every trader must have their own trading rule on this point.
Pair Charts Covering Trade Period (Yahoo!Feed):
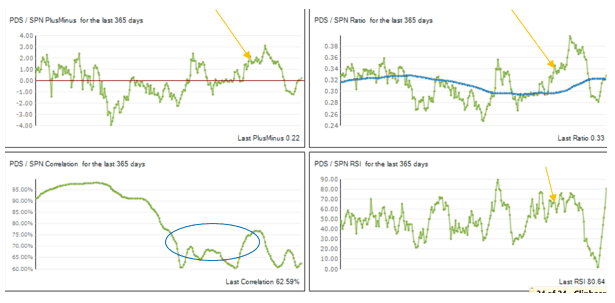
Ratio is not in a breakout at time of Entry Signal, but near resistance (a positive), ratio moving average is flat and ratio has had a lot of criss-crosses over the moving average (positive). Correlation has decayed and zig zagged a bit for the 90 days prior to the signal, but still reasonable at about 70% (positive). RSI of Ratio at time of trade call was at 66.2, close to an extreme (a mild positive).
Conclusion: setup looks reasonable, the trade ranks as a possible entry.
Recent Volatility for Position Sizing Purposes:
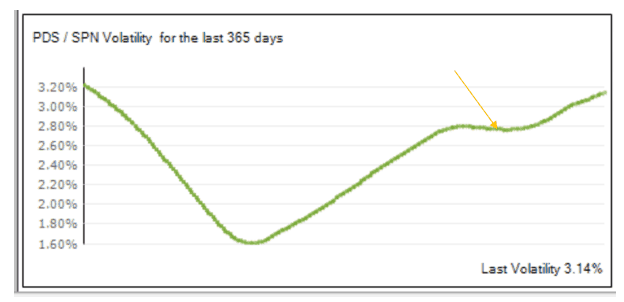
We would rate moderate volatility over last 12 months (range 1.6%-3.2%) though increasing at time of trade at about 2.8%. Suggests mild caution, though within tolerances for a standard position size.
RESULT OF TRADE
EOD Exit Trade Signal 8 March 2018 at -0.44 sd:
![]()
![]()
Short Leg: Buy to Close 2673 shares of PDS at $2.86, Gross Result = $2,378.97
Long Leg: Sell to Close 921 shares of SPN at $9.34, Gross Result = -$1,363.08
Gross Result: $1.015.89, less commissions and slippage estimate and rounding errors of ($90.59) = $925.30.
Resulting Gross Profit of $925.30 in 48 calendar days on $10,000/leg. That’s 9.3% on nominal leg value and up to a 28% return on CFD margined equity (max 6:1).
![]()
