


Live Signal Results:
Our FAST 50 March Vintage U.S. Stock Pairs Performance in First 8 Weeks of Trading, + 17.3%
“The rules of reality can be bent. It just requires thinking in different terms.” Tim Ferriss

Target Monthly Income (TMI), Dreamlines and Lifestyle Design are three concepts highlighted by Tim Ferriss in his blog and discussed in detail in his New York Times bestseller The 4-Hour Workweek.
We recommend to anyone looking to cut the cord from corporate life to read his books and his blog.
He is a master of creating a bespoke professional lifestyle that involves you taking control of:
- how much you earn (as much as you need/want);
- when you earn it (in the least time possible and when you want):
- how you spend it (on the dream lifestyle you take the time to design and cost).
So what do these powerful concepts like Target Monthly Income have to do with stock pair trading?
Well, just about everything we believe.
Let me explain…
Pair Trading for Target Monthly Income In Under 1 Hour/Day
Let’s say you do the work suggested by Tim and you determine that to live your immediate dream lifestyle you need a TMI of $4,000.
Let’s also say that you’ve been working for awhile and have some financial resources available to help you build that lifestyle. For example, perhaps you have $50,000 available that you can afford to risk in building a cash flow generating business, or a “muse” as Tim would call it.
Now we aren’t making any promises or indicating that stock pair trading can allow a trader to generate $4,000/month on a consistent basis on a $50,000 trading account balance. You might make mistakes and lose all that money. The market may do strange and unheard-of things and that principal could be severely impacted. Trading is risky and not for everyone. See our disclaimer at the bottom of this blog.
We are, however, going to run you through the maths on that little muse equation ($50,000 trading account = $4,000/month of income). And we are going to compare these maths with the performance of the LIVE SIGNALS generated by our FAST 50 U.S. Equities Pairs March Vintage in its first two months of trading since launch on 18 March 2021.
So…let’s see what it takes.
$4,000/$50,000 = 8.0%. Needs to be PER MONTH. So 8.0% per month return.
That’s 133.2% per year when you compound 8% per month. That’s a pretty aggressive number for anyone thinking of trading or investing.
We know…some of you who like to be HODLERs of crypto will laugh at that number as something you’ve achieved in a few months (or a few days) this year with Bitcoin, Dogecoin or Ethereum to name just a few.
But at what risk? Bitcoin is down -35% this month. And with what volatility in your monthly returns??? Did you sell out a little every month on the way up? Or are you still holding? Where’s the $4,000/month in consistent cash flow that you can spend on your dream lifestyle?
More importantly, can you expect those types of return over the long-term to continue now that crypto has a larger market cap than all the U.S. Dollars in circulation today?
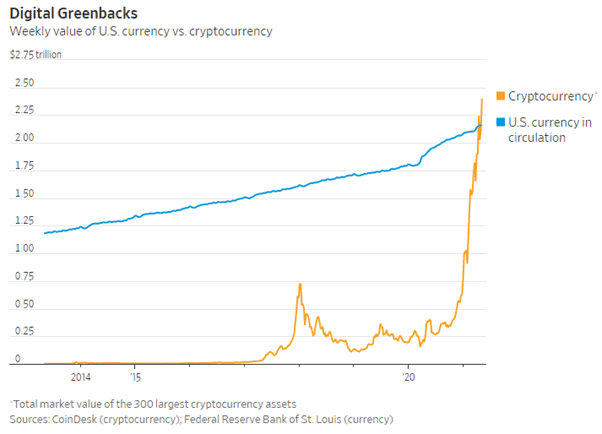
Source: Wall Street Journal, https://www.wsj.com/articles/what-happens-to-stocks-and-cryptocurrencies-when-the-fed-stops-raining-money-11620446420
What if crypto crashes by -80% like Bitcoin did a few years back? How are you left?
Which is where Stock Pair Trading, Target Monthly Income and Lifestyle Design come together.
In a nutshell, if you want to use the financial markets to build a $4,000/month “muse” (cash flow generating business) you are going to need a strategy that protects you from crashes and delivers consistent returns.
And to offer a true “dream” lifestyle, it needs to be done in under 1 hour per day and from anywhere with a broadband connection (we show you how).
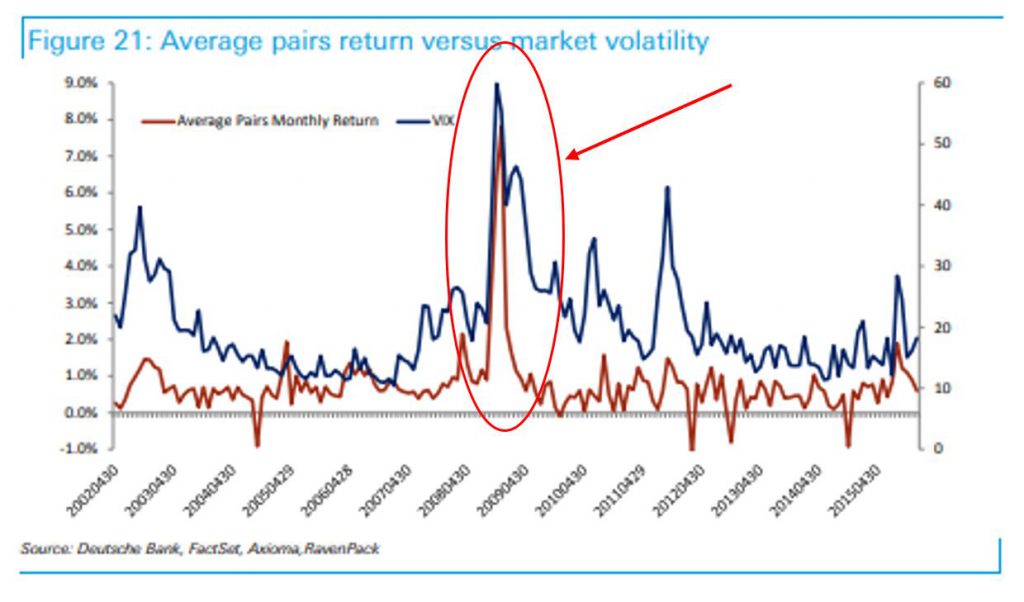
The great news is that market volatility juices stock pair trading returns to further enhance their consistent monthly profitability, and market crashes can bring special opportunities.
Check out the below chart from Deutsche Bank that shows just how S&P500 stock pair trading returns shoot up like crazy during market crashes (2008):
Pair Trading, which you may or may not know, involves simultaneously entering LONG (i.e. BUYING) and entering SHORT (i.e. SELLING) two “paired” securities.
It provides protection from market crashes, controlled risk, low correlation to the market averages and ability to generate significant and consistent returns.
That’s why professional traders and managers are attracted to the stock pair trading strategy and have been using it successfully for over 50 years, in all market conditions.
Multiple recent research studies across the whole S&P 500 universe and using standard parameters have demonstrated returns to be in the range of 2%-4% per month*, on a 4:1 leverage basis, over more than a decade.
Add in the use of Cointegrated Stock Pairs and the historical returns look even stronger**.
So…can those types of returns from stock pair trading get us to our 8% per month needed for our $4,000/month stock market “muse”? Remember that’s 133% per year…
More importantly, those are just studies. Can anyone show some evidence that trading a portfolio of stock pairs kicks off that kind of cash? And can be done in less than an hour per day?
Target Monthly Income from PairTrade Finder®’s FAST 50 Cointegrated U.S. Stock Pairs?
We prefer to put our money where our mouth is.
Some of you may know that when you subscribe to PairTrade Finder® PRO, we include our FAST 50 U.S. Stock Pairs. We’ve arranged for these 50 cointegrated stock pairs to be auto-loaded into our platform when you boot up PRO.
How do we find these pairs?
We analyse and over 1,800 US equities with market caps over $2 billion and daily traded volumes of at least $2 million to find you the best cointegrated stock pairs for you to trade.
What’s more, we update this analysis on a more or less quarterly basis to ensure these pairs stay fresh and their correlations and cointegrations strong to offer you the highest-probability setups.
All pairs must meet strict fundamental correlation criteria and profitability and robustness measures.
Additionally, when you subscribe to our market-leading pair trading platform, you are stepping in to a 2-4 week training course to help you create your “muse”.
Add in the FAST 50 we have curated for you and we’ve done the heavy lifting to get you moving in your right direction.
How has the latest FAST 50 Vintage performed?
Have a look…
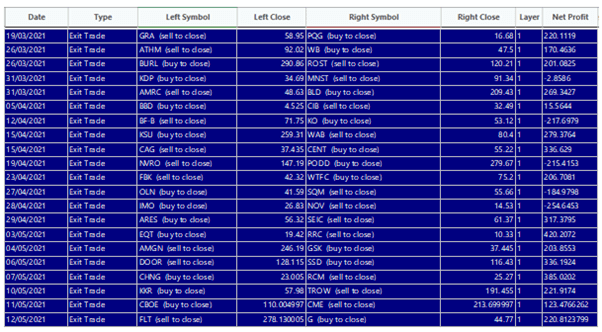
FAST 50 U.S. Stock Pairs March 2021 Vintage: Live Signal Results – Intraday Basis
Here are all of the unfiltered, closed trades and their net results since the FAST 50 March 2021 Vintage launched, when traded on an Intraday basis:
And here are all the Open PnL positions as of Market Close on 14 May 2021:
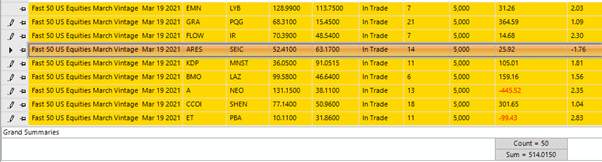
We can summarise these results as follows:
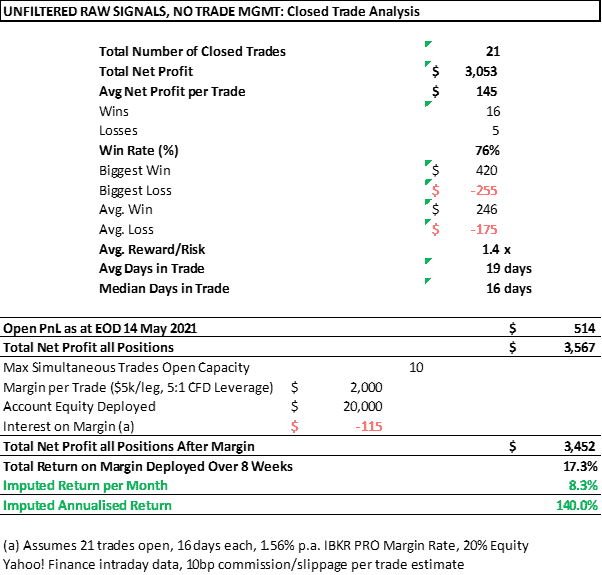
And there you have it…
Live signals from PairTrade Finder®’s FAST 50 Cointegrated Stock Pairs delivered:
- a 17.3% return on imputed account equity;
- a 76% win rate;
- a 1.4x Reward/Risk ratio;
- and $3,452 in profit ($20,000 account margin, $5k/leg trade size);
…all in two months.
That’s 8.3% per month on account margin, imputes to 140% per year.
See disclaimer below.
If we scale up that profit from a $20,000 margin deployed to the $50,000 account size we discuss above (times it by 2.5), we are looking at $8,630 of profit in two months. Or $4,315/month.
Welcome to our “muse”!
What’s more, these results are from raw, unfiltered signals from these pairs, with no filtering for corporate actions, proximate earnings dates and no trade management (e.g. trailing stop losses, dynamic price targets).
Let’s not forget that our net exposure to the market over that period was roughly 0%. We had equal amounts of capital in long and short positions, to help protect from any adverse market swings.
How long did it take to manage? Well, each entry signal typically takes about 10-15 minutes to filter based on our methodology. You can filter when you get the trade signal email, which will be during market hours, and as long as you have broadband and a device (or can call your broker).
The exit signals are just systematic trade executions which – if using our semiautomatic trading integration with Interactive Brokers – take a few minutes each.
So 21 entries x 15 minutes/entry + 21 exits x 3 minutes per exit = 378 minutes in 2 months.
That’s about 47 minutes per week…we leave it up to you to decide what to do with the other 3 hours and 13 minutes left over to reach Tim Ferriss’ 4-Hour Workweek.
Learn more any time at www.pairtradefinder.com
Happy Trading!
The PairTrade Finder® Team
* See https://blog.pairtradefinder.com/pair-trading-research-studies-articles/ for studies underlying pair trading’s profitability.
NB: The FAST 50 example pairs in PairTrade Finder® PRO and the trading signals generated therefrom are provided for informational and educational purposes only. They should not be construed as personalised investment advice. It should not be assumed that trading using the parameters demonstrated by the Software will be profitable and will not result in losses. Please see our full Terms & Disclaimer here.
