


![]()
Here is the second lesson in our 3-part mini Pair Trading Educational Series. Together with our eBook Trade Like a Hedge Fund, these lessons should help you rapidly choose profitable pair trading signals from PairTrade Finder® PRO.
Happy Trading!
Pair Trading Educational Series: Lesson Two
It’s true that the largest hedge fund in the world uses pair trading. Jim Simons of Renaissance Technologies confessed to Congress In November 2008 he pair trades stocks. Jim actually worked for the CIA back in the 1960’s cracking code. He is also a PhD in maths and the 55th richest person in the world as ranked by Forbes.
Jim achieved a 2,738% return on billions of dollars over ten years.
He is not alone in using pair trading; in fact long/short trading is one of the most common trading strategies among hedge funds. This is no coincidence; pair trading is a very reliable strategy.
Do hedge funds use candlestick charts, MACD’s, RSI’s?
Maybe a few, but not very many.
So why do the majority of online retail traders use these lagging indicators that don’t work while the professional trading community use something completely different?
The answer is perception.
With so many trading books and services all promoting technical analysis its natural for a newcomer to think this must be the way to successfully trade. The reason you don’t see too many books go into detail about profitable pair trading strategies is because any likely author is already using the strategy profitably and doesn’t need to write a book.
A Brief History of Pair Trading
The first known practitioner of pair trading was Jesse Livermore back in the late 1800s and early 1900s. Livermore is the character documented in the highly popular book Reminiscences of a Stock Operator. Jesse referred to pair trading as sister stocks – he would find a strong performing stock, buy it and look for a very similar ‘’sister’’ stock to short its weakness. Jesse was very successful at trading and was said to be worth more than $100 million, an astronomical figure back in those days. $100 million in 1900 is worth $29.2 billion in 2017 dollars (Source: www.in2013dollars.com)
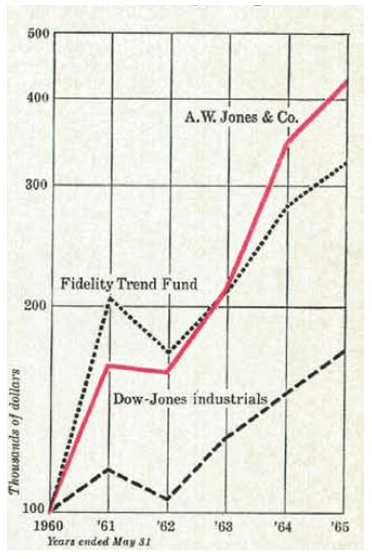
The first “hedge fund” was created by Alfred Winslow Jones, an Australian educated at Harvard and Columbia. Jones used the concept of having a leveraged portfolio of longs and shorts to generate alpha, a very new concept at the time. The year was 1949. His fund grew steadily over time and then from 1960-65, A.W. Jones & Co. returned 325%, despite the 20% management incentive fee. The fund and Jones were profiled by Carol Loomis of Fortune magazine, in her 1966 article The Jones Nobody Keeps Up With. Loomis coined the term “hedge” fund, referring to the long/short nature of Jones’ trading.
That article, and Jones’ track record, led to over 130 new hedge funds being set up in the next three years, including Soros’ Quantum Fund and Michael Steinhardt’s Steinhardt Partners.
The hedge fund industry didn’t stand in its own right until the 70s, gained traction throughout the private investment community in the 80s and 90s. Growth accelerated over the next two decades with institutional investors climbing on board. As of Q1 2019, assets under management in hedge funds exploded to north of $3 trillion, making the hedge fund community a true force with which to be reckoned (Source: BarclayHedge). Of those amounts, over $300 billion is held in Equity Long/Short and Equity Market Neutral funds.
The Pair Trading Opportunity
Why do profit opportunities in pair trading exist?
As long as there is more money sloshing around in mutual funds, pension funds, large institutions, sovereign wealth funds, family offices than there are pair traders the opportunities will always exist.
These big funds have investment guidelines and rules. Most of them aren’t even allowed to short securities, that gives us an edge immediately. These players represent the majority of trading volume transacted. Their trades move markets. They don’t care whether Coke is trading in line with Pepsi – if they want a position they will proceed with the order ticket and most of the time not even look at the stock price. Some funds are index tracking – meaning when a stock is added or dropped from an index they must replicate that move in their portfolio too.
Traders can profit from these movements.
So What Does a Pair Trade Look Like?
Let’s take Melco Resorts & Entertainment vs. Wynn Resorts (MLCO/WYNN) as an example.
Below is a trade example from our proprietary software, PairTrade Finder® PRO:
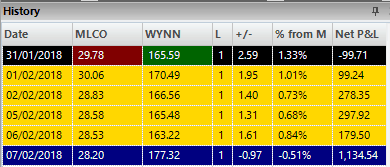
Left column is the closing prices of MLCO, right is WYNN.Red means go short, green means go long.
Blue means exit.
So we sold MLCO @ 29.78 and covered at 28.20 for a 5.31% profit.
We bought WYNN @ 165.59 and sold at 177.32 for a 7.08% profit.
The trade lasted 6 days.
The number 2.59 on the entry date represents how many standard deviations the pair was above its mean – generally you place trades when pairs are more than 2 standard deviations from the mean.
The 1.33% represents how much in % terms the pair was above its mean.
The Net P&L column gives you the cumulative running P&L of the trade on a day by day basis. The $-99.71 on the day of entry represents the commissions and slippage estimate we used in this analysis (we use 25bp per trade leg, each pair trade entry or exit being two legs).
As you can see we made a small amount on the MLCO trade. We made more (and mainly in one day) on the WYNN trade.
Though both trades made money in this example (it’s great when this happens!) generally you make more on one side than you win/lose on the other side. This situation is a result of the market or sector moving in one direction and generally both stocks go in that same direction. However, one side of our pair should outperform the other.
How do we know how many shares to trade?
Ideally, in pair trading you want to remain dollar neutral, which means an equal amount of capital invested in both the long and short side (some people beta-weight their leg sizes, we don’t usually. Beta can be tricky to measure accurately – leverage needs to be taken in to account, time periods decided etc.).
Using our above example, if you wanted $10,000 exposure on each side, you would take 10,000 and divide by the share price – the result equals your desired position size.
So for MLCO (10,000/29.78) =336 shares to short.
WYNN (10,000/165.59) = 60 shares to buy.
In this example we would have made $1,134.54 after our commission and slippage estimates are taken into account.
Do We Use Stop Losses in Pair Trading?
We at PairTrade Finder® tend to only use time-based stop losses – that is we exit after a certain amount of days have passed, regardless of profit or loss, if an exit signal hasn’t been given.
We don’t generally use %age, standard deviation, ATR or $-based stop losses as in many cases these types of stops have been shown in backtesting to harm long-term performance. Some people do. It all depends on your psychological constitution. Also, the market guns for stop loss levels and more often than not your stop loss will be hit, then the stock price snaps back, leaving you frustrated, to say the least. By only using a time-based stop loss we give the stocks room to move and come back to the mean (60 days is our default). Remember, the more conditions you set on a trade, the more the market has to conform to you instead of you being adaptive. We prefer to use a small position-size (risking 1-2% of account value per trade) and let the trades run to time.
In our latest version of PairTrade Finder® PRO, however, we’ve just implemented a Max Loss Alert function, based on $-loss. If you prefer to follow a max loss ($) stop loss strategy, PRO can now send you an alert any time the consolidated P&L of any of your Watchlist pairs trades below that defined max loss. Many of our users have asked for this function, and we are constantly upgrading PRO to give our users the functionality and flexibility they want.
This concludes Lesson 2. In Lesson 3, we will cover recent studies on the profitability of the pair trading strategy.
If you would like to watch a Video Demonstration of how to find historically highly profitable, cointegrated and correlated stock pairs to trade with PairTrade Finder® PRO in UNDER 10 MINUTES, click here.
Happy trading.
