


Tip # 4 – Review The Correlation Chart
Investopedia defines “correlation” as a statistic that measures the degree to which two securities move in relation to each other. Correlations are used in advanced portfolio management. Correlation is computed into what is known as the correlation coefficient, which has value that must fall between -1 and 1.
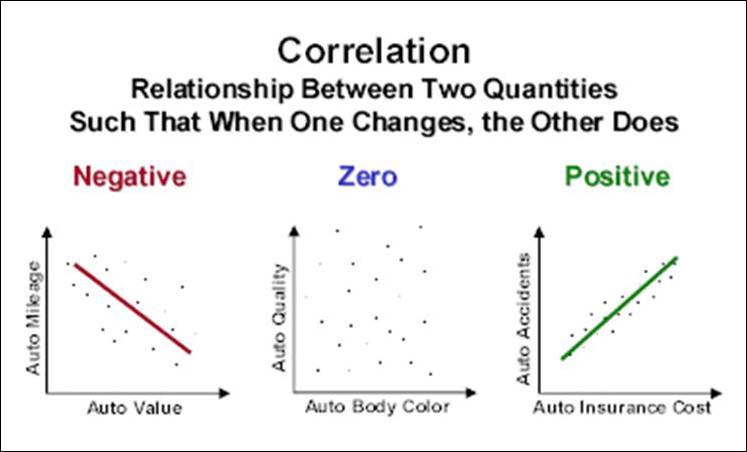
A perfect positive correlation means that the correlation coefficient is exactly 1. This implies that as one security moves, either up or down, the other security moves in lockstep, in the same direction. A perfect negative correlation means that two assets move in opposite directions, while a zero correlation implies no relationship at all.
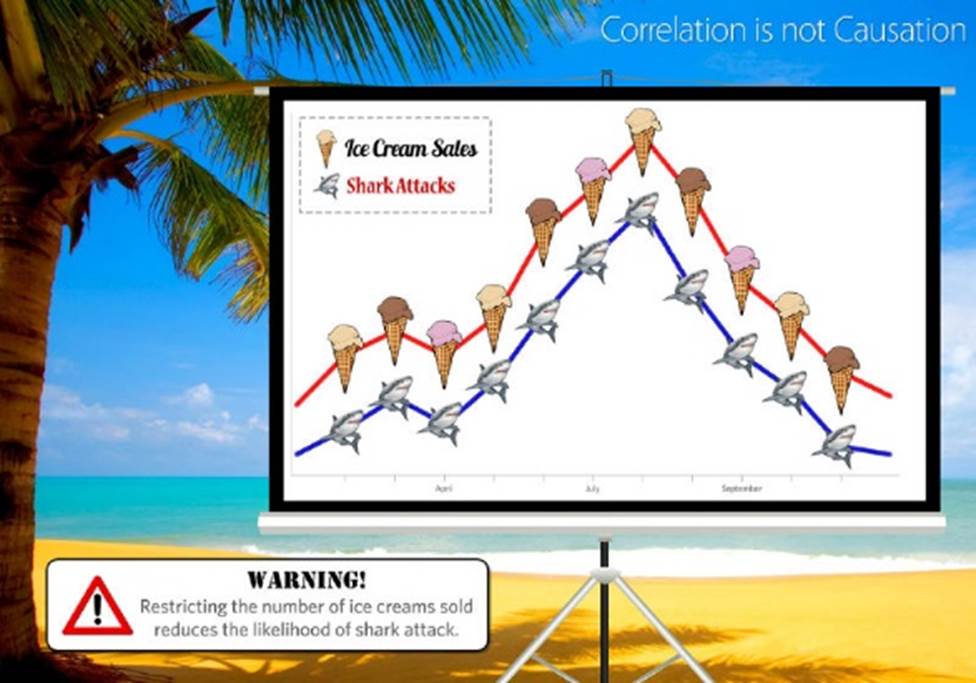
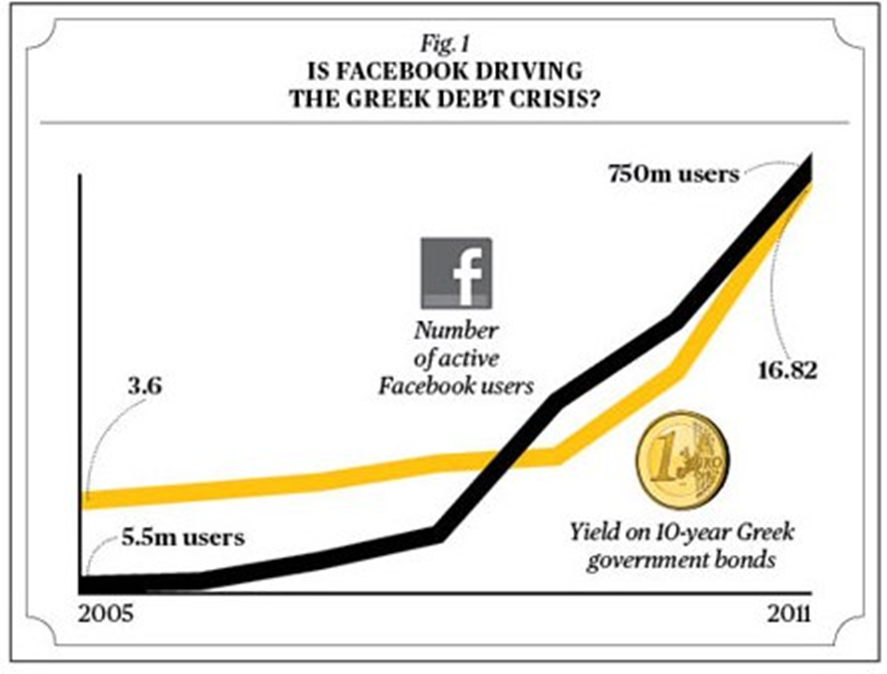
But note that correlation is not causation – ie rising ice cream sales does not necessarily increase the number of shark attacks (see figure below).
For example, large-cap mutual funds generally have a high positive correlation to the Standard and Poor’s (S&P) 500 Index, very close to 1. Small-cap stocks have a positive correlation to that same index also, but it is not as high, generally around 0.8.
However, put option prices and underlying stock prices tend to have a negative correlation. As the stock price increases, the put option prices go down. This is a direct and high-magnitude negative correlation.
Correlation goes to the heart of what pair trading is all about. Pairs trading is a market-neutral trading strategy that matches a long position with a short position in a pair of highly correlated instruments such as two stocks, exchange-traded funds (ETFs), currencies, commodities or options.
As with nearly any investment, taking a pairs trade involves more than just hitting the buy and sell button. The steps required to enter and exit a pairs trade:
Assemble a list of potentially related pairs
Just as long-only stock traders scan the markets for suitable securities, a pairs trader must start with a list of potentially related pairs. This entails conducting research to find securities that have something in common – whether the relationship is due to sector (such as the auto sector) or to asset (for example, bonds). While any random pair could theoretically be correlated, it is more likely that we will find correlation in securities that have something in common to begin with.
Determining the correlation level
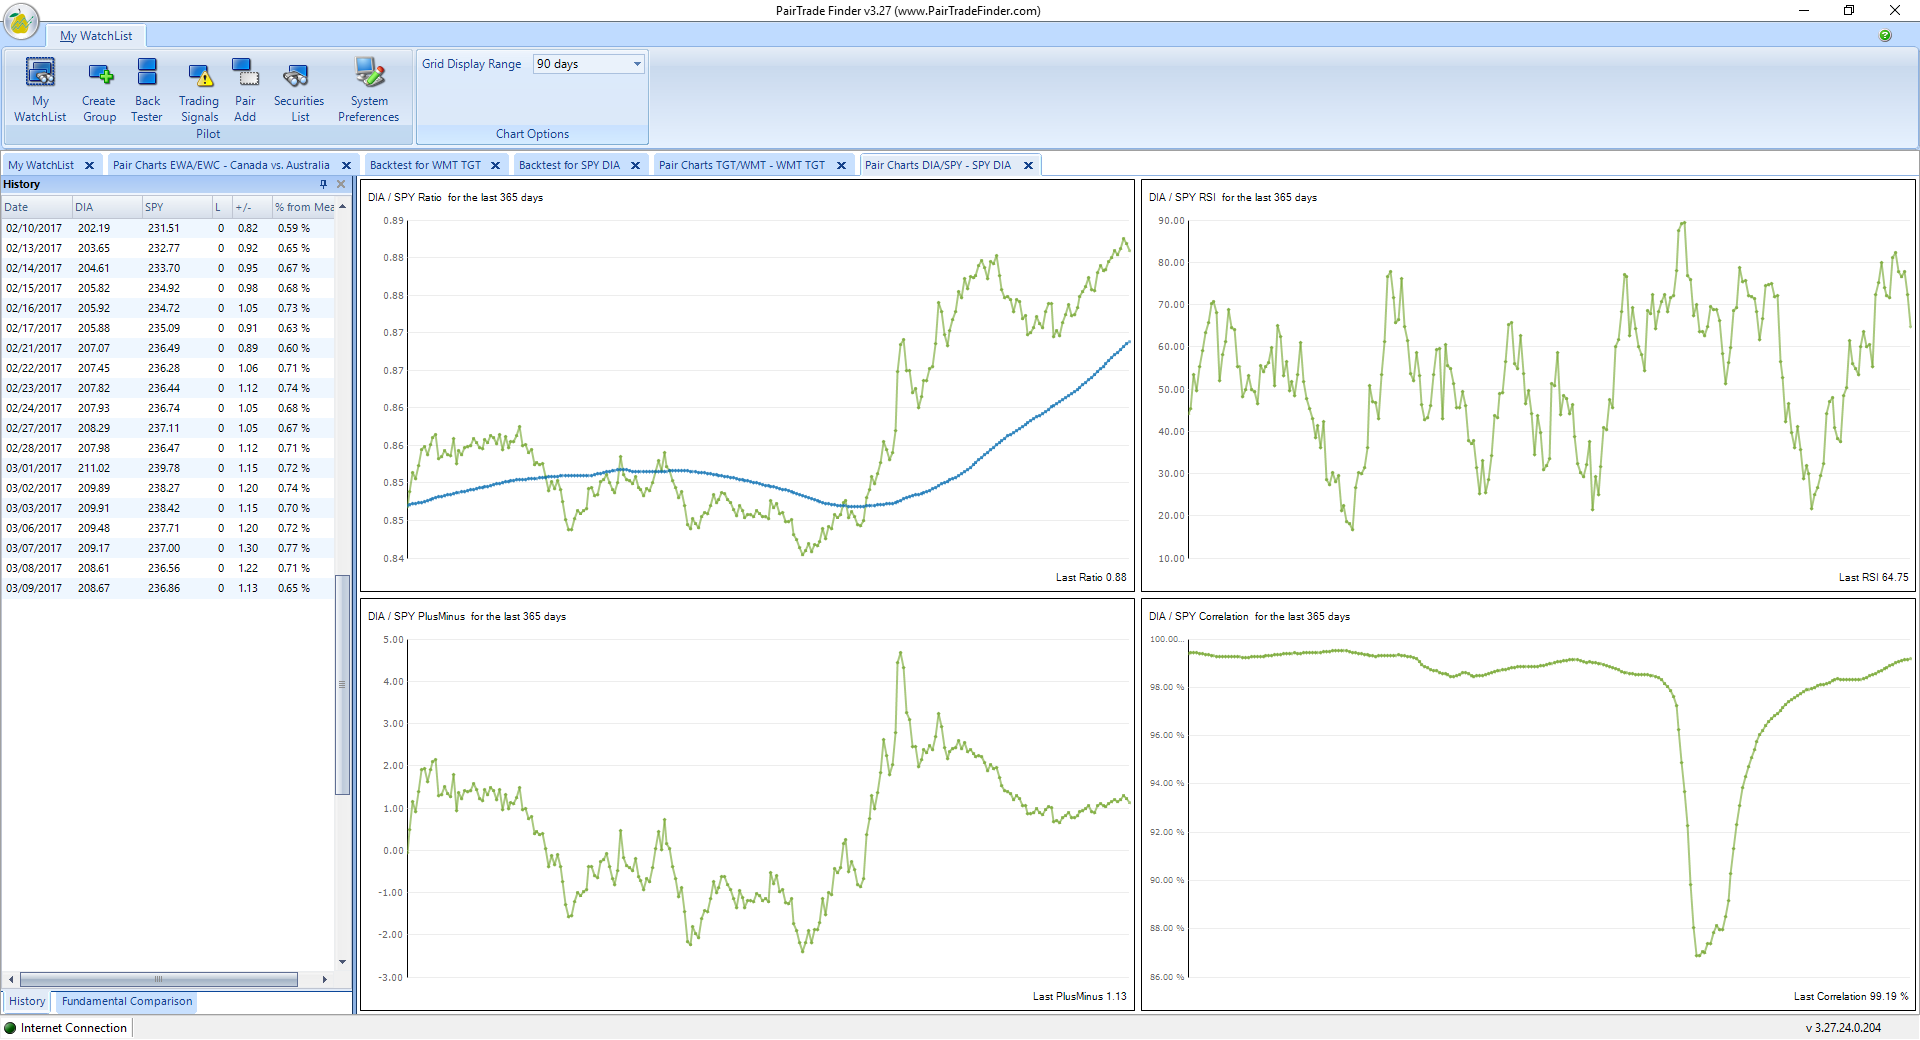
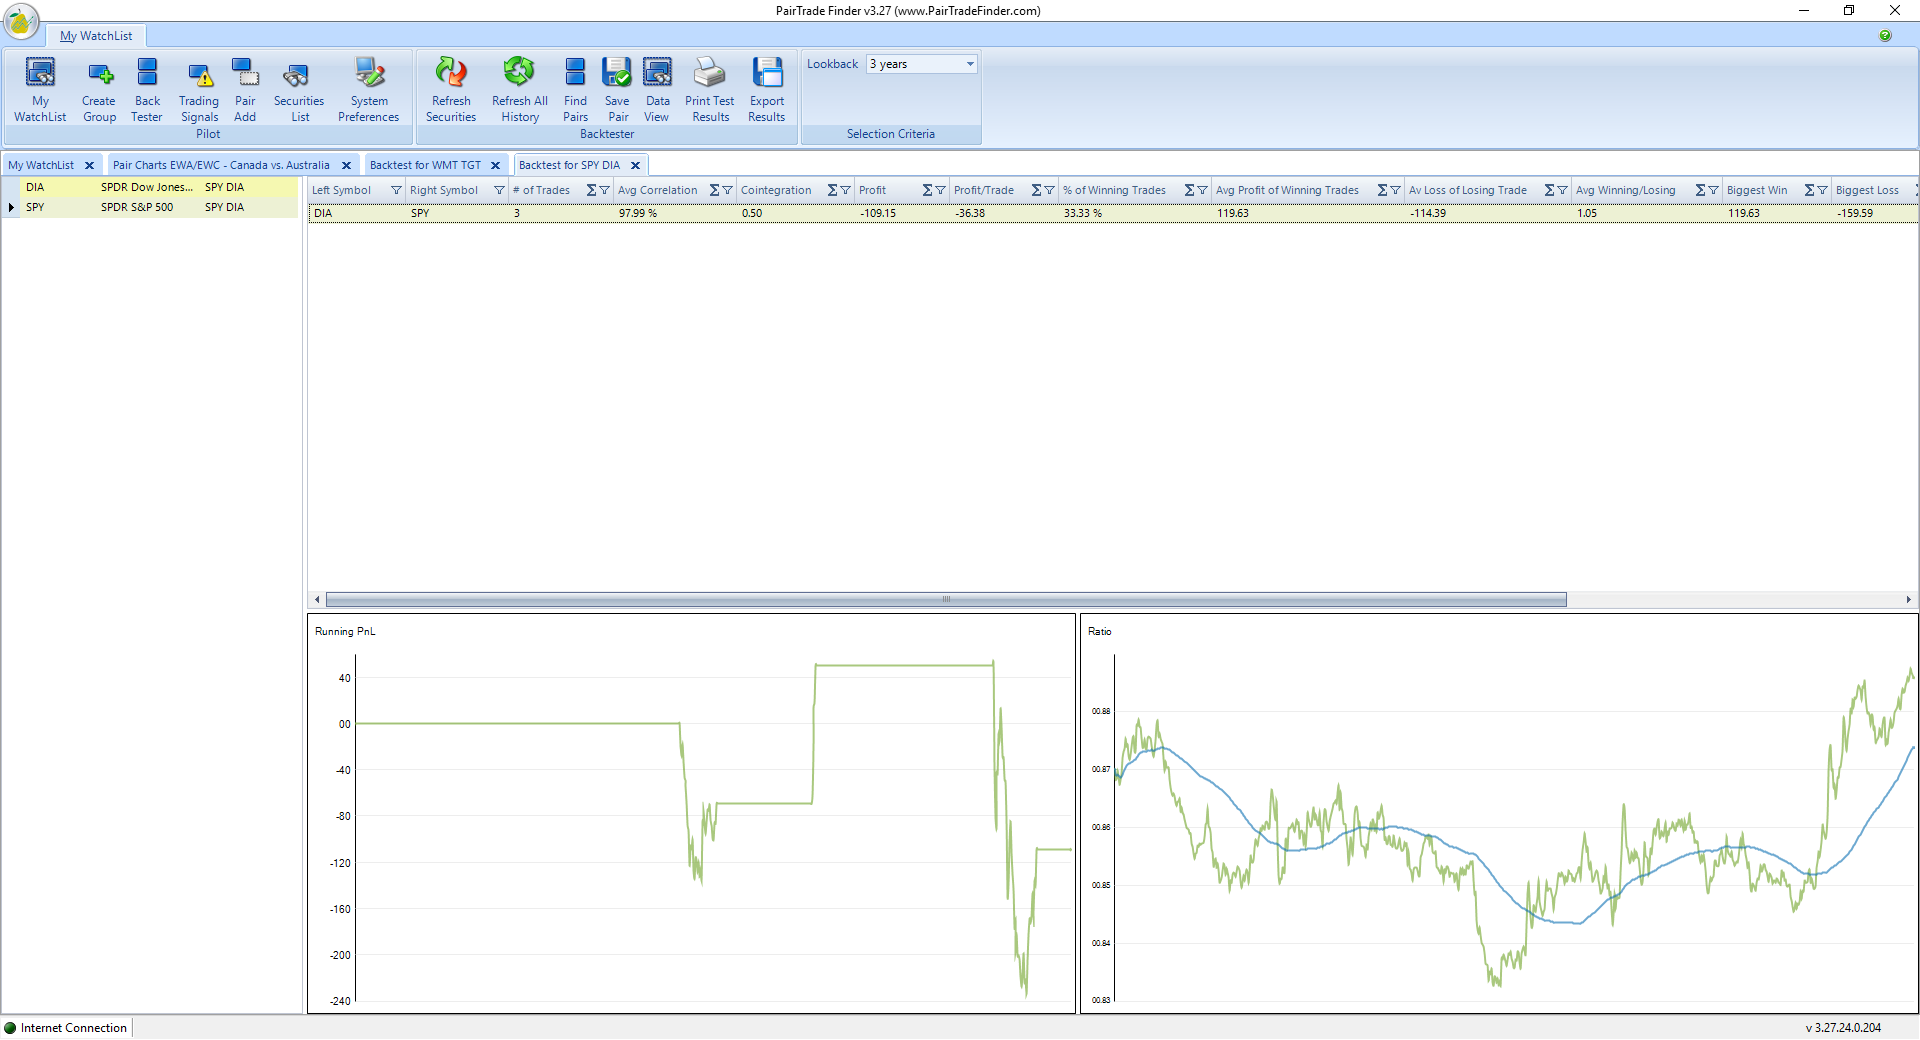
The next step acts as a filter, or a means by which we can reduce the number of potential pairs in our quiver. One way is to use a correlation coefficient to determine how closely two instruments are related. The figure below shows a daily chart of the ETF of the S&P 500 and the ETF of the Dow. Below the price chart is an indicator that shows the correlation in the lower right hand corner. We can see from the chart that during the time period evaluated, the ETFs SPY and DIA are highly correlated, with values hovering around 0.98. We will keep the SPF/DIA pair on our list of potential pairs candidates, even they have not been particularly profitable in the past year.
Another chart, shown in the figure below, illustrates a pair that is not correlated. In this example, a daily chart of Wal-Mart (WMT) and Target (TGT) shows little correlation between the two instruments, despite the fact that they “have something in common”. Here, the correlation coefficient demonstrates that the relationship is scattered, ranging from high values of about 0.8 to values below zero, indicating a lack of correlation. In this case, we can probably remove the WMT/TGT pair from our list of potential pairs candidates, even though the pair has been profitable over the past year – even more profitable than the highly correlated S&P 500 vs the Dow pair shown above.
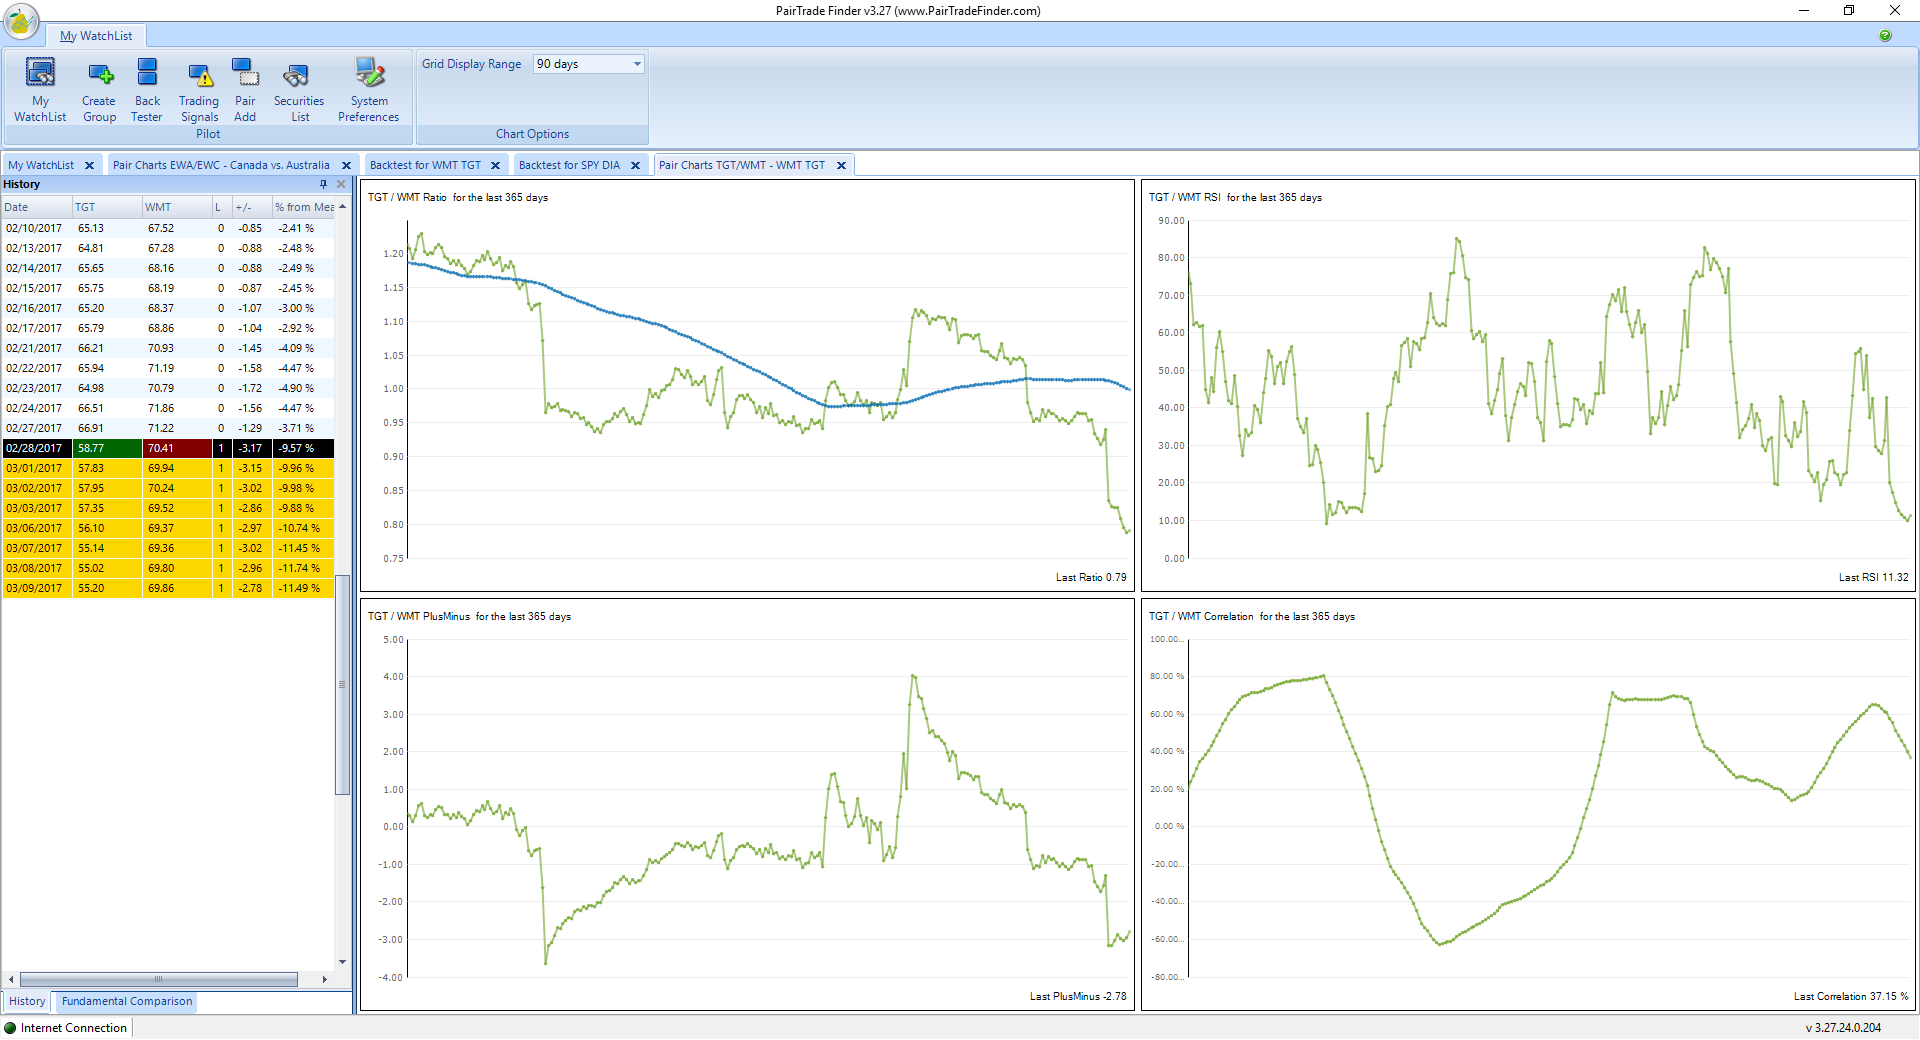

Click to view full version
If this concept of correlation seems too complicated, think of it this way:
EXAMPLE #1:
As temperatures INCREASE, sales of ice cream INCREASE as well.
EXAMPLE #2:
As temperatures DECREASE, the volume of clothes that people wear INCREASES.
These relationships (i.e. increased temperatures = increased ice cream sales AND decreased temperatures = increased clothing volume) are so “common sense” and fundamental, in fact, that we likely ignore them completely.
However, just as correlation is not the same as causation, one must also be careful not to confuse correlation with coincidence. As the chart below shows, for a time the yield on the Greek 10 government bonds rose at the same rate as the number of Facebook users rose, but this was a were coincidence.
When the correlation between the two securities temporarily weakens, i.e. one stock moves up while the other moves down, the pairs trade would be to short the outperforming stock and to long the underperforming one, betting that the “spread” between the two would eventually converge. The divergence within a pair can be caused by temporary supply/demand changes, large buy/sell orders for one security, reaction for important news about one of the companies, and so on.
Pairs trading strategy demands good position sizing, market timing, and decision making skill. Although the strategy does not have much downside risk, there is a scarcity of opportunities, and, for profiting, the trader must be one of the first to capitalize on the opportunity.
A simplified example
Pepsi (PEP) and Coca Cola (KO) are different companies that create a similar product, soda pop. Historically, the two companies have shared similar dips and highs, depending on the soda pop market. If the price of Coca Cola were to go up a significant amount while Pepsi stayed the same, a pairs trader would buy Pepsi stock and sell Coca Cola stock, assuming that the two companies would later return to their historical balance point. If the price of Pepsi rose to close that gap in price, the trader would make money on the Pepsi stock, while if the price of Coca Cola fell, he would make money on having shorted the Coca Cola stock.
The reason for the deviated stock to come back to original value is itself an assumption. It is assumed that the pair will have similar business idea as in the past during the holding period of the stock.
See the charts below of the recent history of PEP and KO backtested as a pair trade, as shown in the Pairtrade Finder software:
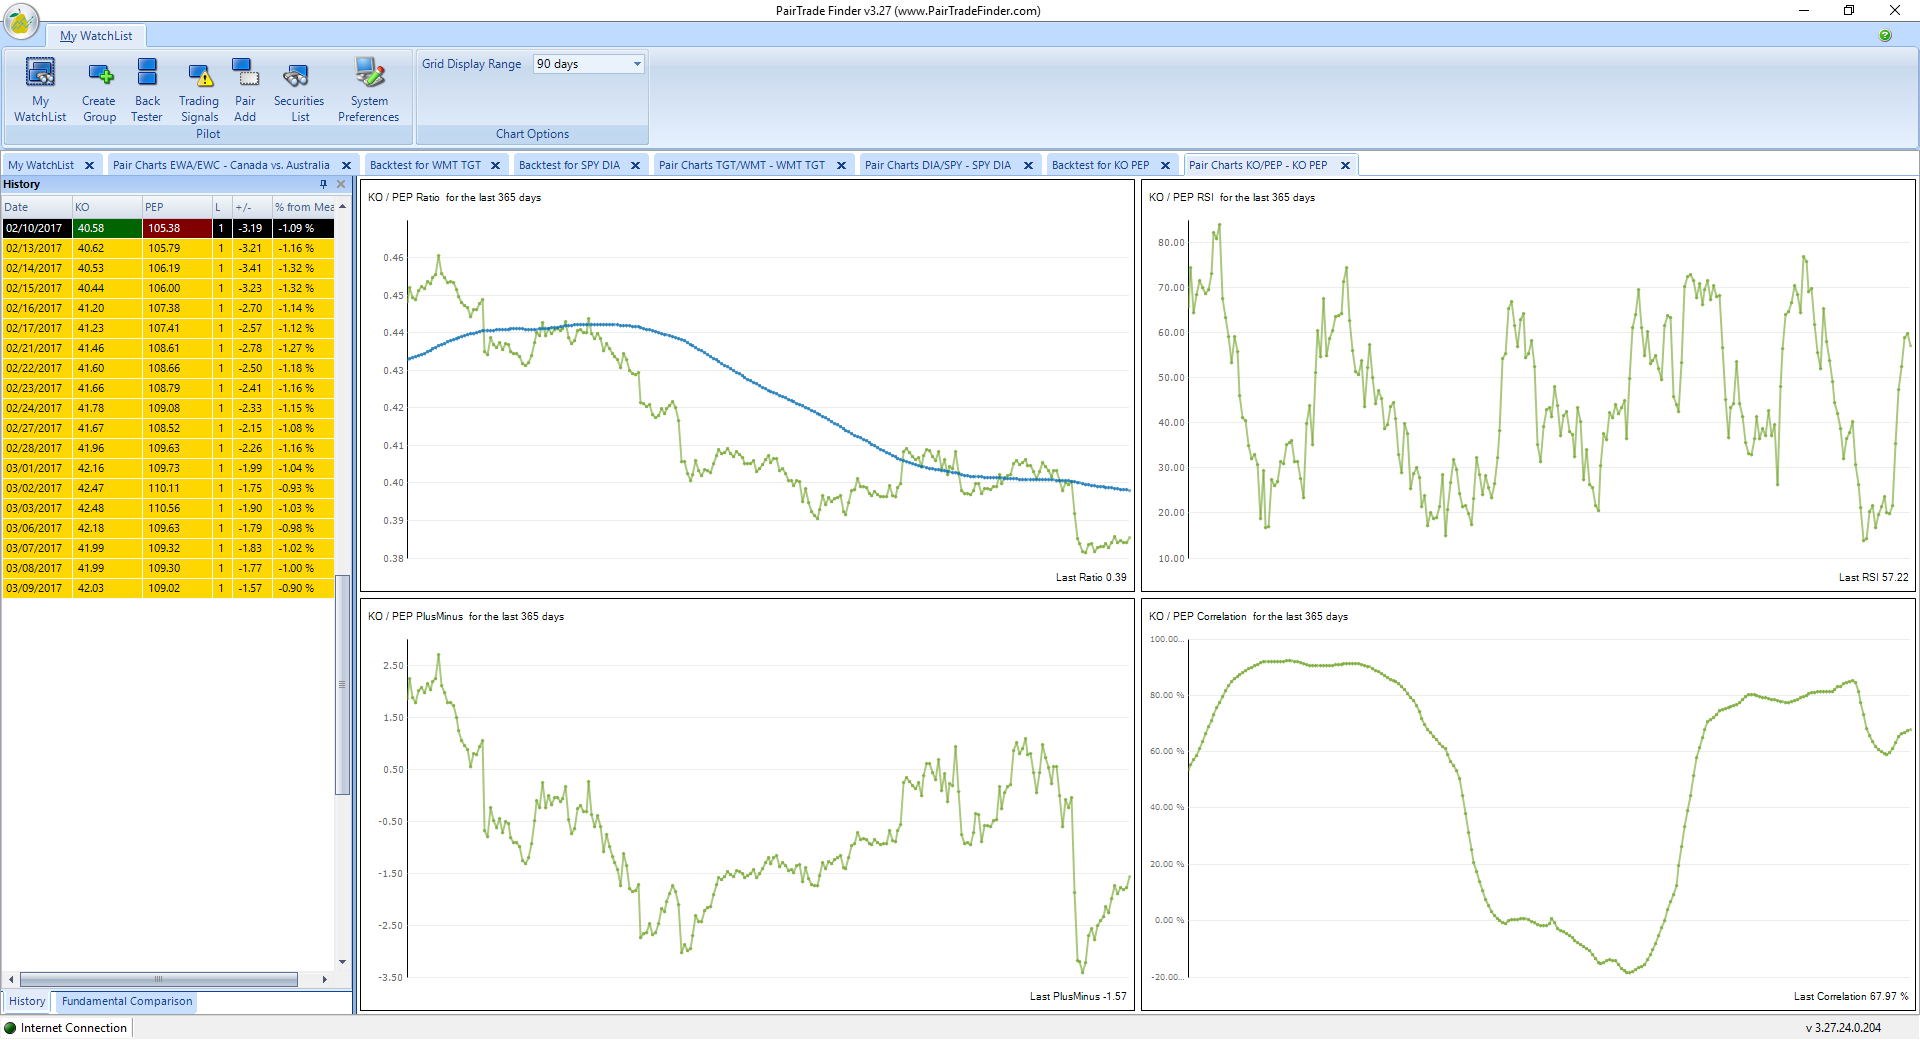
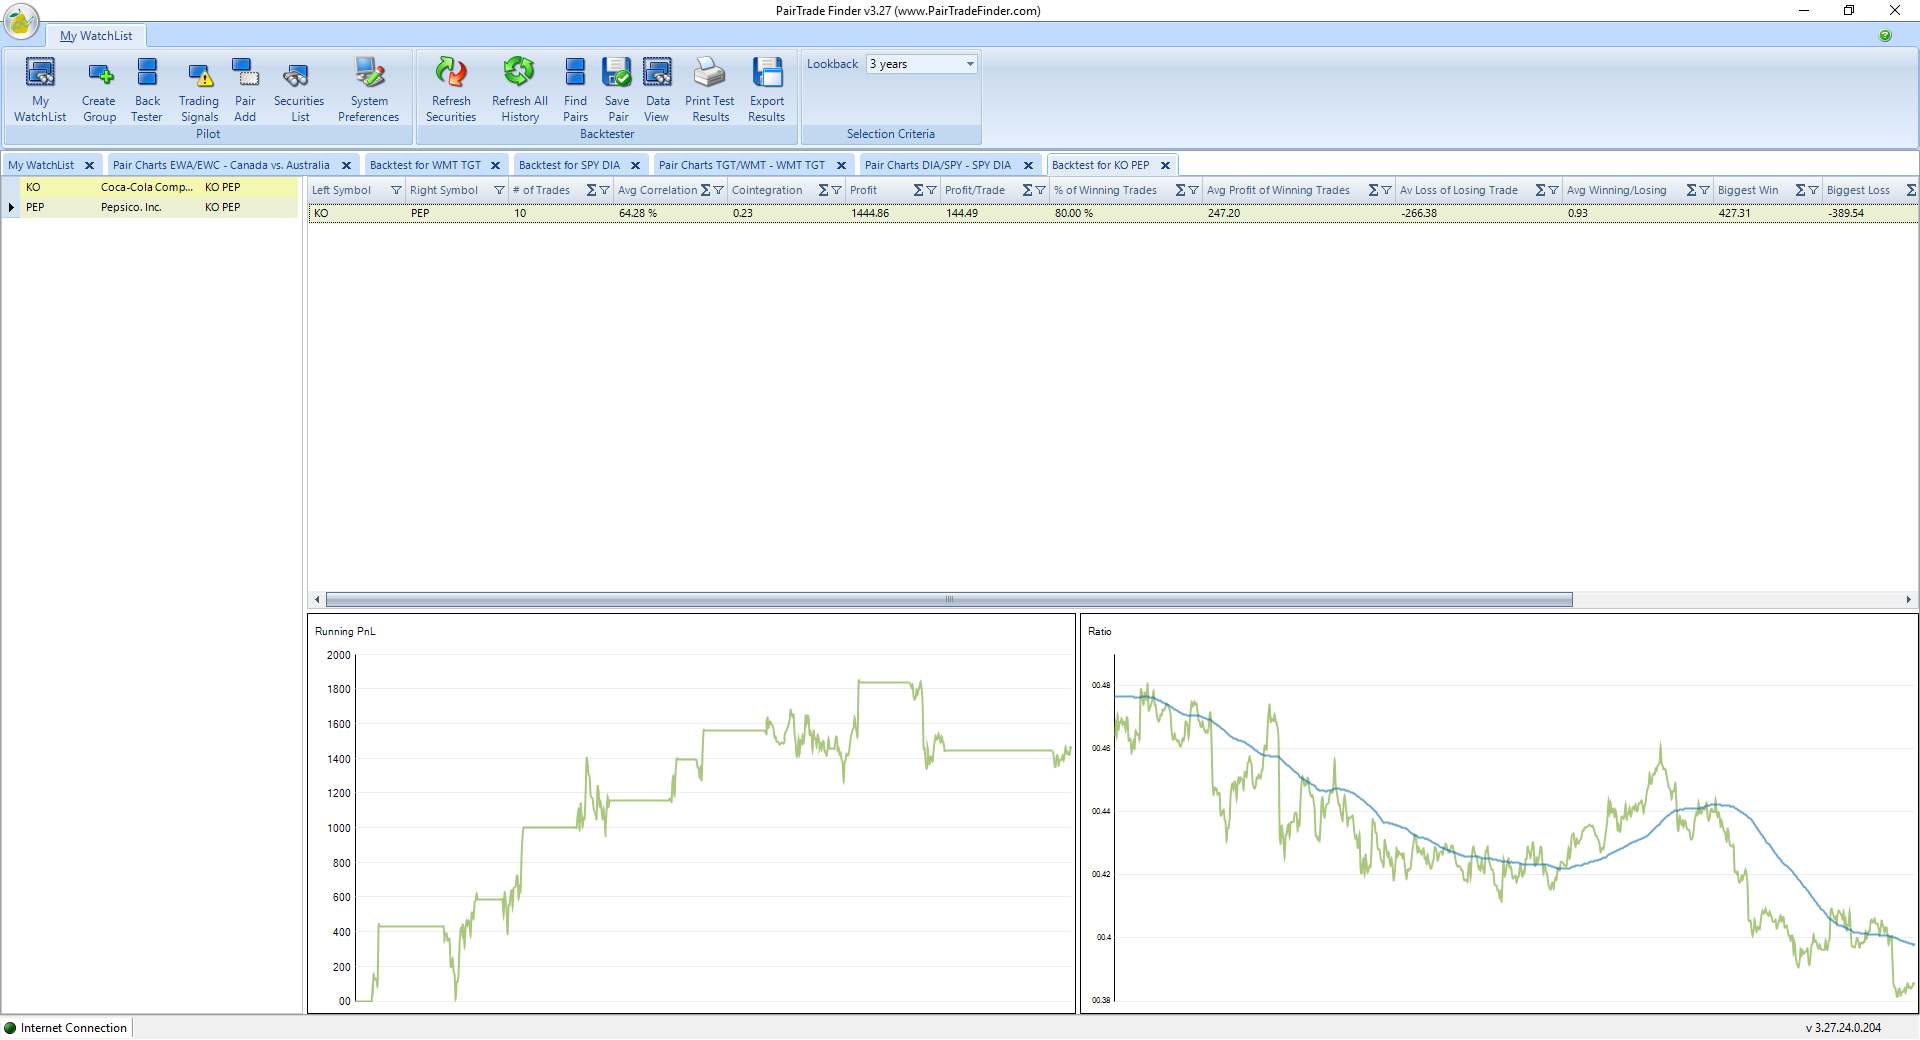
When finding and selecting pair trades using Pairtrade Finder software, ideally you want a high correlation (above 70%) and for the correlation reading to have never gone below 60% in the last 100 days; the higher the better. Also cross-check the co-integration of the pair – look for 80% or better over the same period. (More on using co-integration in Pairs Trading will follow in an upcoming Trading Tip.)
Accurate correlation calculations for screening and backtesting a universe of securities pairs require access to and rapid mathematical manipulation of an enormous amount of data.
Contact us to start your 30-day free trial of Pairtrade Finder software, the perfect software tool designed to help you easily and quickly find high probability securities pairs to trade.
Wishing you consistent profitability,
Pairtrade Finder
