


Since January 2025, our PTF USA Equities Stat Arb Engine has quietly executed a fully automated, rules-based strategy across 136 US equity pairs using our Interactive Brokers’ paper trading facility. We have discussed previously the headline performance (+17.4% net return, –3.6% max drawdown, Sortino ~3.8). Now let’s dive into the trade-by-trade statistics that underscore why this is not just luck.
Trade-Level Performance: Precision in Execution
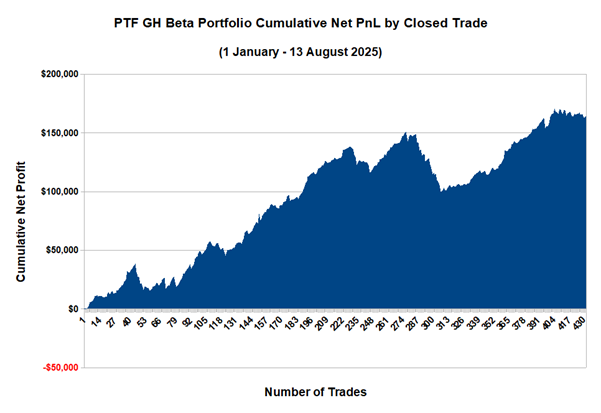
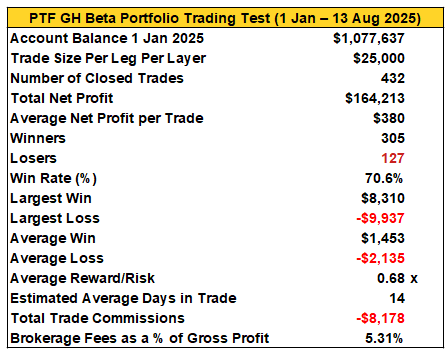
The strategy employs a mean-reversion framework, targeting temporary pricing dislocations. We curate a universe of highly correlated and cointegrated US equity pairs in the same or similar industry sub-sector. Our automated stat arb engine then initiate trades based on multi-factor signals (e.g., cointegration strength, z-score divergence >2.5SD). We position-size according to a defined theoretical max loss per trade of 1.5% of account equity. Trades are exited via a pre-defined threshold. Over the 7.5-month review period, the portfolio closed 432 trades, yielding the following auditable metrics:
- 432 closed trades in ~7.5 months — high turnover yet disciplined execution
- Win rate ~71% — showing that consistency, not a few outliers, drives performance
- Average reward/risk ratio about 0.7x — the system packs enough reward to ensure that win rate leads to strong performance
- Average Profit per trade – small, consistent gains compound to robust portfolio-level returns
- Average Monthly Compound Return — +2.2% over 7.4 months
- Average holding period of 14 days — swing-trading, mean-reversion timeframes dominate
- Biggest winner / loser per trade metrics reveal the tail behaviour is well controlled (e.g. worst loser limited to ~–20%, biggest winner ~+15%)
- Trade-efficient – brokerage commissions just 5% of Gross Profit
Below are two visuals, both a scatter plot and a histogram of trade % age returns distribution of each trade on its capital at risk ($25,000 per leg, per layer, $50,000 total per layer):
These charts dispel any notion that returns are the result of just a few lucky trades. One can see the distribution is clean, symmetric-ish, without extreme skew. Average return per trade of ~1.5%.
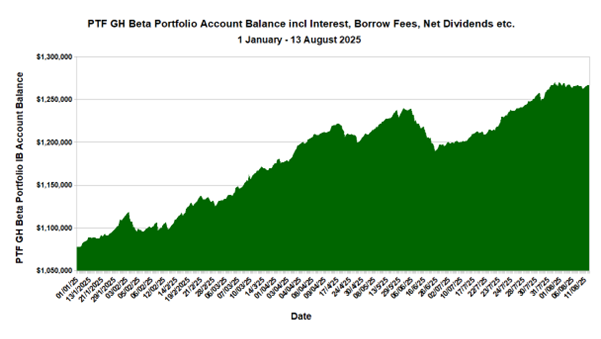
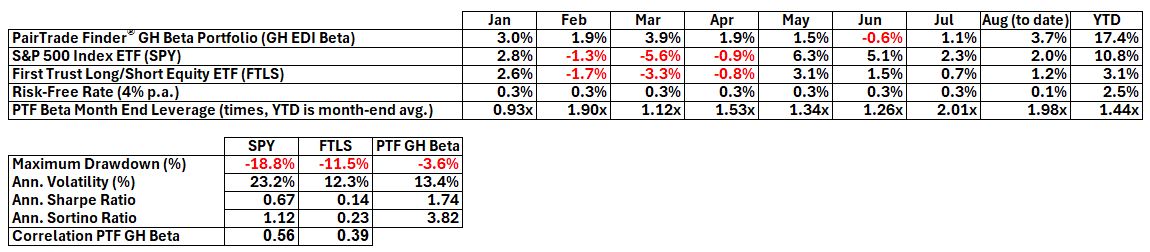
The All-In Performance of Our Stat Arb Engine
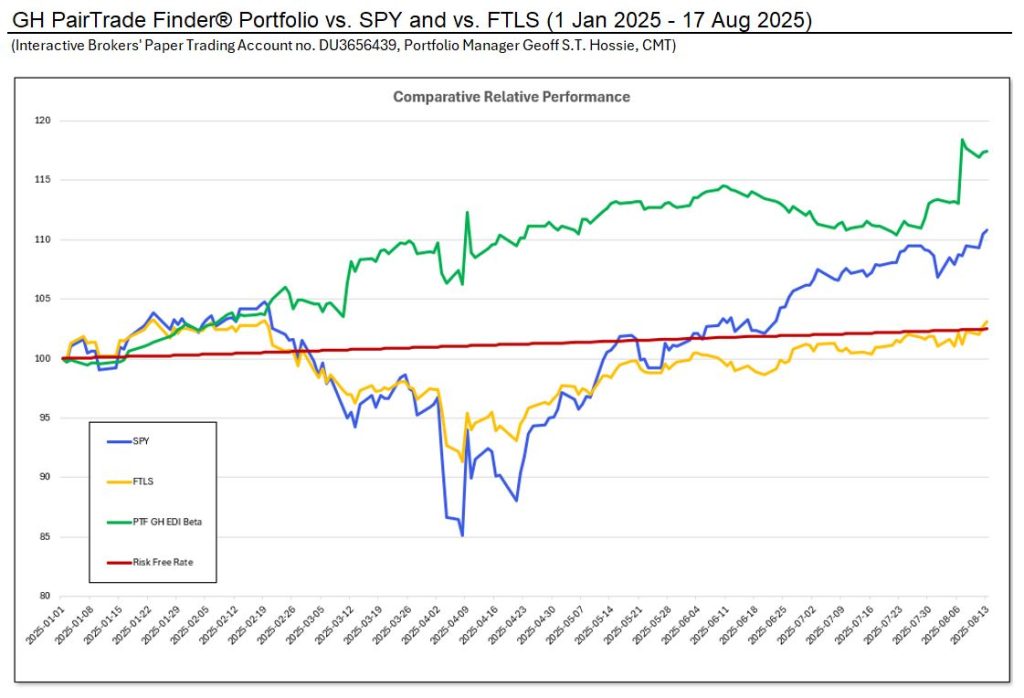
Let’s take a look at how the actual account balance in the paper trading account fared over the period. We need to take into account interest credits and debits, net dividends, stock borrow fees, commissions etc. The below chart and table show as closely as possible the actual IB account balance for the portfolio for the period. We also display the performance statistics, and benchmark comparisons:
Why These Stats Matter (To You)
Institutional allocators demand more than a headline return. They ask: “How robust is the edge? How consistent? What’s the drawdown behaviour?”
These trade-level numbers tell a story of disciplined risk management, repeatable edge, and low-latency automation. Our system and engine ensure each trade is monitored, sized, and exited systematically. No discretion, no guesswork, just our automated stat arb engine at work.
If you want to see the detailed trade ledger, dig deeper into slippage & attribution, or discuss integrating this strategy into your portfolio or ETF structure — reach out.
Best regards,
The PairTrade Finder® Team
www.pairtradefinder.com | Award-Winning Pair Trading Software
