


After years of macro-driven markets and passive dominance, something important has changed in equity markets.
Dispersion is back.
Dispersion measures how differently individual stocks move relative to one another. When dispersion rises, relationships between correlated stocks temporarily break down—creating the exact inefficiencies that statistical arbitrage strategies are designed to exploit.
And in 2025 and 2026, dispersion surged.
During recent volatility shocks, sector rotations, tariff news and macro news pushed many historically related stocks and ETFs significantly out of alignment. For traders running equity market neutral strategies, these dislocations create a large opportunity set for mean-reversion trades.
Dispersion Measured
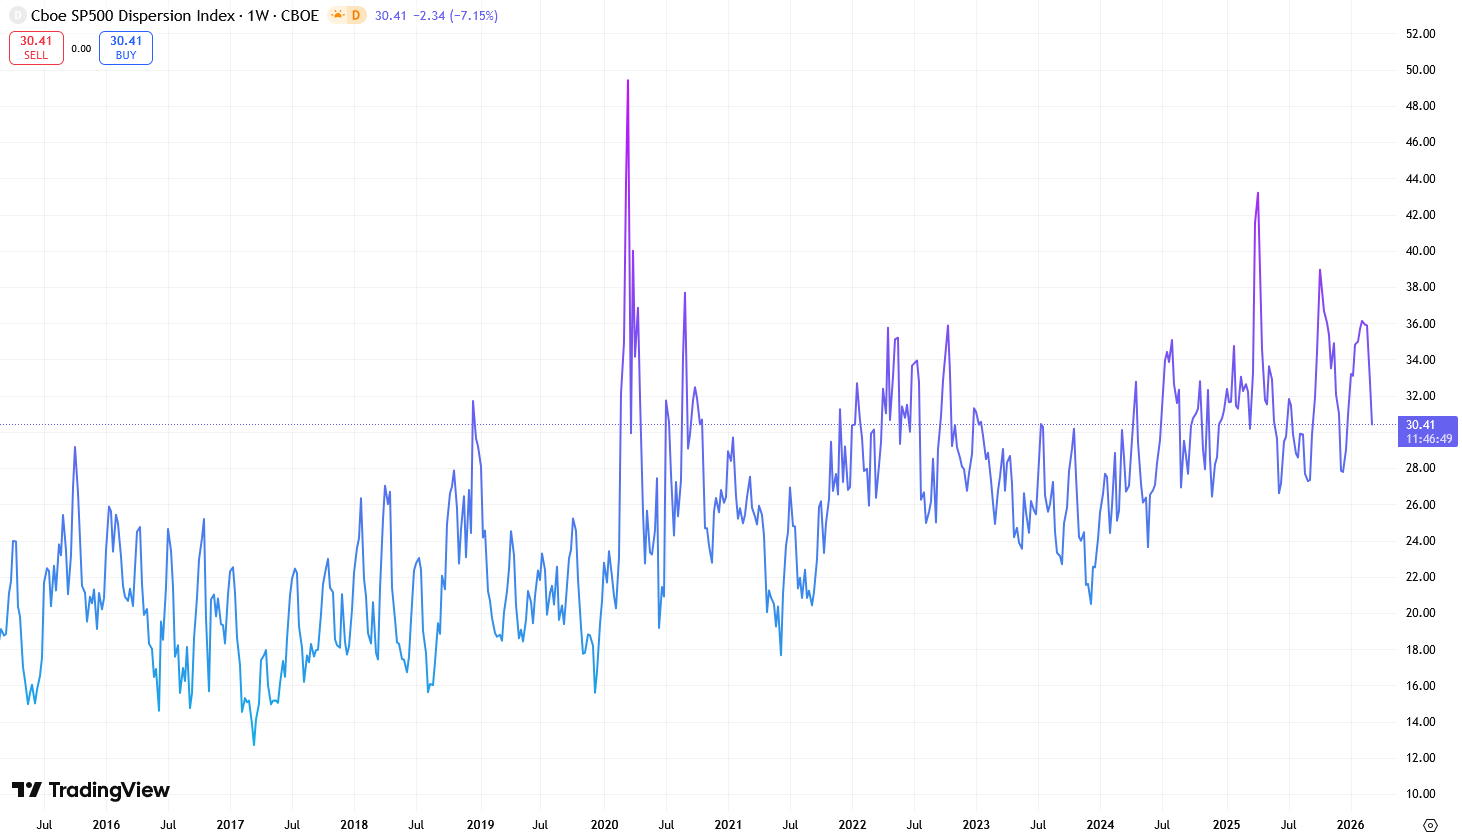
One way to measure this phenomenon is using the CBOE Disperion Index. The Dispersion Index provides an indicator for the market’s expectation of the magnitude of idiosyncratic movements in S&P 500 constituent prices over the next 30 days.
Among other applications, the Dispersion Index may help portfolio managers assess the opportunity set for stock picking and alpha generation (Source: CBOE)
The chart below of the CBOE Dispersion Index (DSPX) shows the clear trend of increasing dispersion over the last 10 years:
Calm Market Indices Can Hide Dispersion
And while overall market indices may appear calm, the underlying behavior of individual stocks tells a very different story. The chart below from Nomura further illustrates the absolute return dispersion of S&P 500 stocks over the past 30 years.
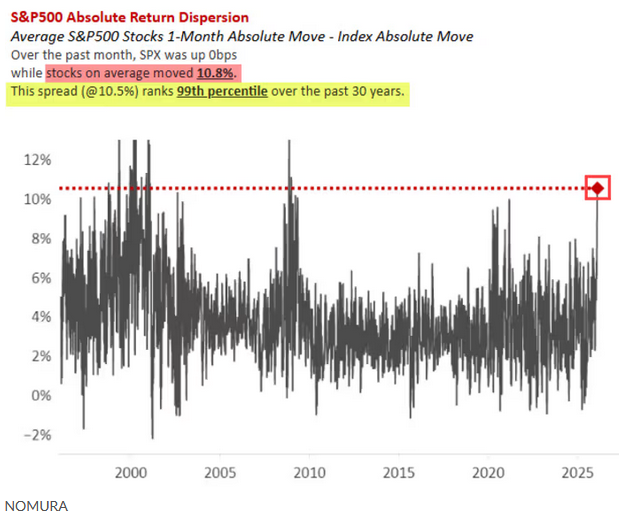
Key observations:
- Over the past month, the S&P 500 index itself was essentially flat, yet stocks on average moved 10.8%.
- This level of dispersion ranks in the 99th percentile over the past 30 years, signaling extreme stock-level idiosyncrasy.
- Such an environment is perfect for equity market neutral and statistical arbitrage strategies, which profit from relative divergences between correlated stocks or ETFs.
In other words, even when the headline index shows little movement, the market is teeming with independent price action. For traders focused on relative-value strategies, this is a highly fertile environment: temporary mispricings are abundant, mean-reversion opportunities are numerous, and structural inefficiencies can be exploited systematically.
Higher volatility.
Broken correlations.
More temporary inefficiencies.
That combination creates ideal conditions for market neutral traders.
Statistical Arbitrage Strategies Have Worked for Over 50 Years
Equity market neutral strategies are not new.
Statistical arbitrage and pairs trading have been core strategies on Wall Street for more than 50 years, pioneered by quantitative trading groups and later adopted by many of the world’s most sophisticated hedge funds.
The logic is straightforward:
- Identify securities that historically move together
- When their relationship diverges, short the outperformer and buy the underperformer
- Profit when the spread converges back toward its historical equilibrium
Because the strategy simultaneously holds long and short positions, it largely neutralizes market exposure. Returns are generated from relative value mispricings, rather than the direction of the overall market.
That’s one reason institutional investors allocate billions to equity market neutral strategies. The AQR Equity Market Neutral Fund, currently with over $3 billion of assets under management, shows the power of pairs trading:
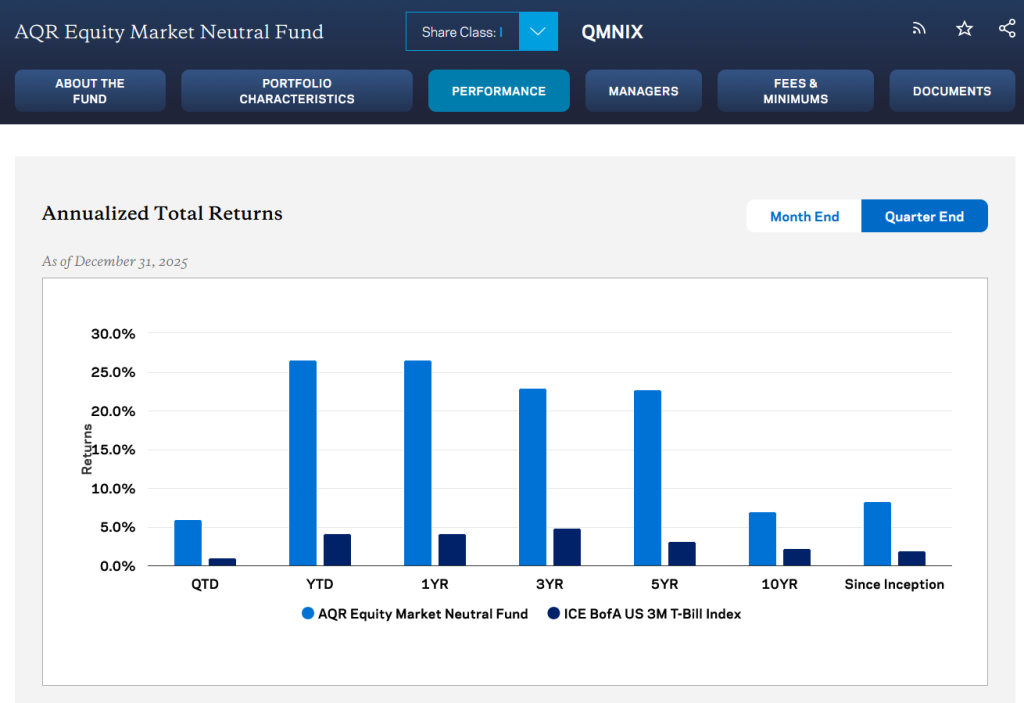
This type of strategy has historically produced strong risk-adjusted returns with low correlation to traditional assets, making it a valuable diversifier for institutional portfolios. N.B.: those returns above are with conservative institutional leverage levels and AFTER management and performance fees. Hmmmmm.
Why Retail Traders Can Have an Advantage
Interestingly, statistical arbitrage strategies can favor smaller traders.
Large hedge funds managing billions face a structural limitation: position size. Many profitable statistical relationships exist in relatively small spreads between stocks or ETFs, where deploying large amounts of capital becomes difficult without impacting market prices.
Sophisticated retail traders don’t face that constraint.
Smaller portfolios allow traders to:
• Enter niche relative-value opportunities
• Trade companies too small for large funds
• Diversify across dozens or hundreds of independent pairs
In many cases, this creates a structural edge for disciplined individual traders.
But historically, one major challenge remained.
Infrastructure.
PairTrade Finder®: Institutional Tools for Individual Traders
Running a professional statistical arbitrage trading strategy traditionally required expensive infrastructure: real-time and historical data, quantitative research tools, portfolio monitoring systems, and automated execution platforms.
That’s exactly what PairTrade Finder® Ultimate Alpha 3 was designed to provide.
The platform allows traders to:
• Discover statistically robust stock, ETF and FX pairs
• Monitor spread behavior and mean-reversion signals
• Build diversified equity market neutral portfolios
• Execute trades automatically using real-time data
PairTrade Finder® integrates directly with Interactive Brokers’ Trader Workstation®. TWS is one of the most efficient and lowest-cost execution platforms available to professional traders.
A Pitcure Is Worth a Thousand Words
See the chart below of the PTF Core Ratio™ of the two iShares Country ETFs EWI (Italy) and EWJ (Japan). These are two of the most indebted Western economies in the world. The green line is the daily reading of the PTF Core Ratio™ and the blue line is the 60-day moving average of that ratio. The E’s are trade entries and the X’s are trade exits. 6 winners out of 6 in a year, and the 7th is already nicely in profit:
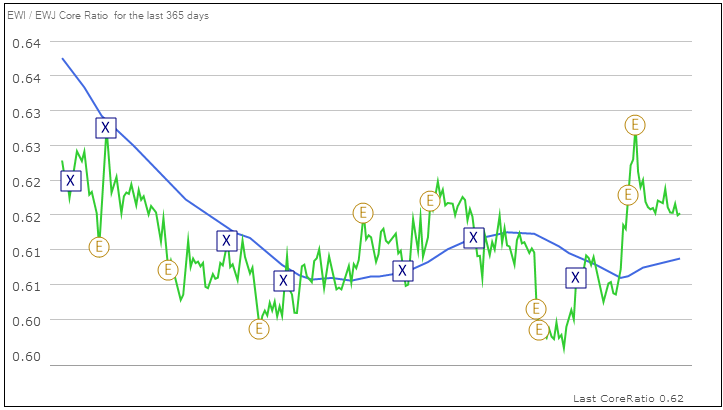
This type of price ratio behavior—temporary divergence followed by convergence—is the core opportunity. Statistical arbitrage traders seek to capture it systematically.
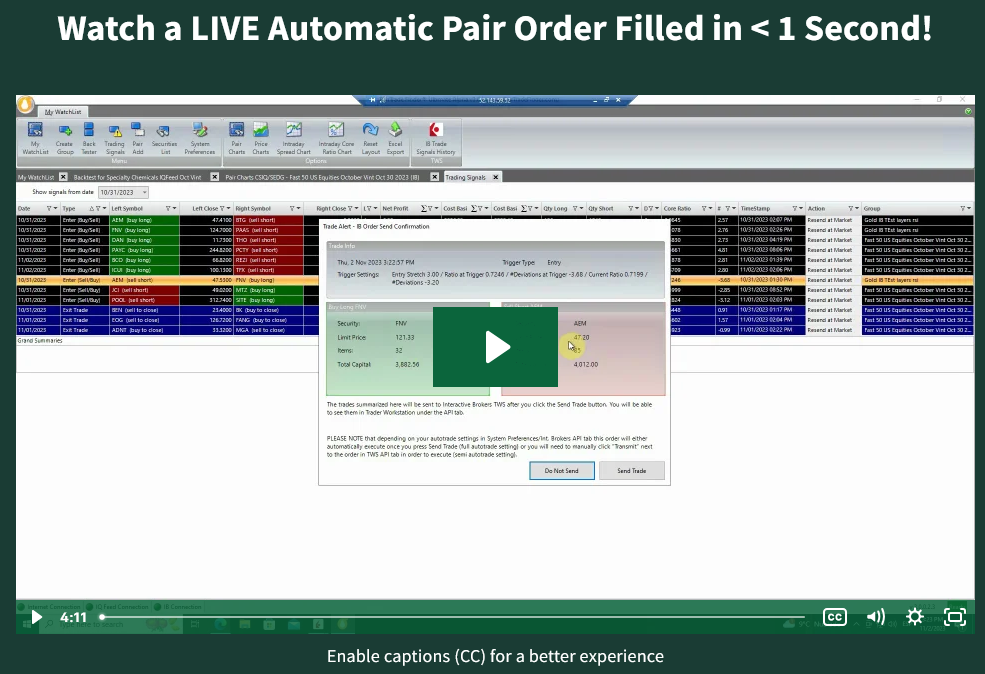
Automated Trading into Interactive Brokers
How about having a trading platform sitting on your desk that can monitor markets on a minute-by-minute basis for these opportunities? Then autotrade them as they arise directly into your Interactive Brokers’ account? Watch PairTrade Finder® Ultimate Alpha 3 in action below:
The Opportunity Right Now
The combination of:
• Rising stock dispersion
• Higher volatility and sector rotation
• Structural advantages for smaller traders
creates one of the most attractive environments in years for statistical arbitrage strategies.
For sophisticated traders willing to approach markets systematically, equity market neutral trading offers a powerful way to generate alpha independent of market direction.
And with the right tools, individual traders can now execute the strategy with the same discipline and automation used by professional hedge funds.
Capture the Opportunity
PairTrade Finder® Ultimate Alpha 3 allows traders to:
✔ Identify amd monitor, in real-time, high-probability statistical arbitrage opportunities
✔ Build diversified equity market neutral portfolios
✔ Automate execution directly through Interactive Brokers
In today’s volatile, high-dispersion markets, relative value trading may be one of the most powerful edges sophisticated traders can deploy. Start a no-commitment 15-day free trial today, and get complementary access to our entire trader-training video library. Get up the learning curve at warp speed! We will even throw in a 25% discount because you read this whole post.
Happy trading!
Geoff S.T. Hossie, CMT & the PairTrade Finder® Team
