


Category Archives: Trading Tips
Pair Trade CLF Versus SWC
The Pairtrade Finder analytic generated a signal to purchase Cliffs Natural Resources and Sell/short Still Water Mining Co. Both companies are in the mining and natural resources space. Infrastructure stocks, which include CLF are under pressure, as traders are concerned about the viability of Trumps legislative plans. CLF is scheduled to release earnings which are on April 27 and Still Water is schedule to provide financial results on May 5th, 2017. The is no stock specific news that is driving the pair lower.
The watchlist shows the levels to enter the trade, as the stretch reached 2.7 standard deviations below the 100-day moving average. … Read More →
Pair Trade HAL Versus TS
The Pairtrade Finder analytic generated a signal to purchase Haliburton and Sell/short Tenaris SA. Both companies are oil service giant. There was news reported on Tuesday that Tenaris believed that the jobs it will be creating in Texas will allow them to still import steel for their products into the United States.
The watchlist shows the levels to enter the trade, as the stretch reached 2.7 standard deviations below the 100-day moving average.
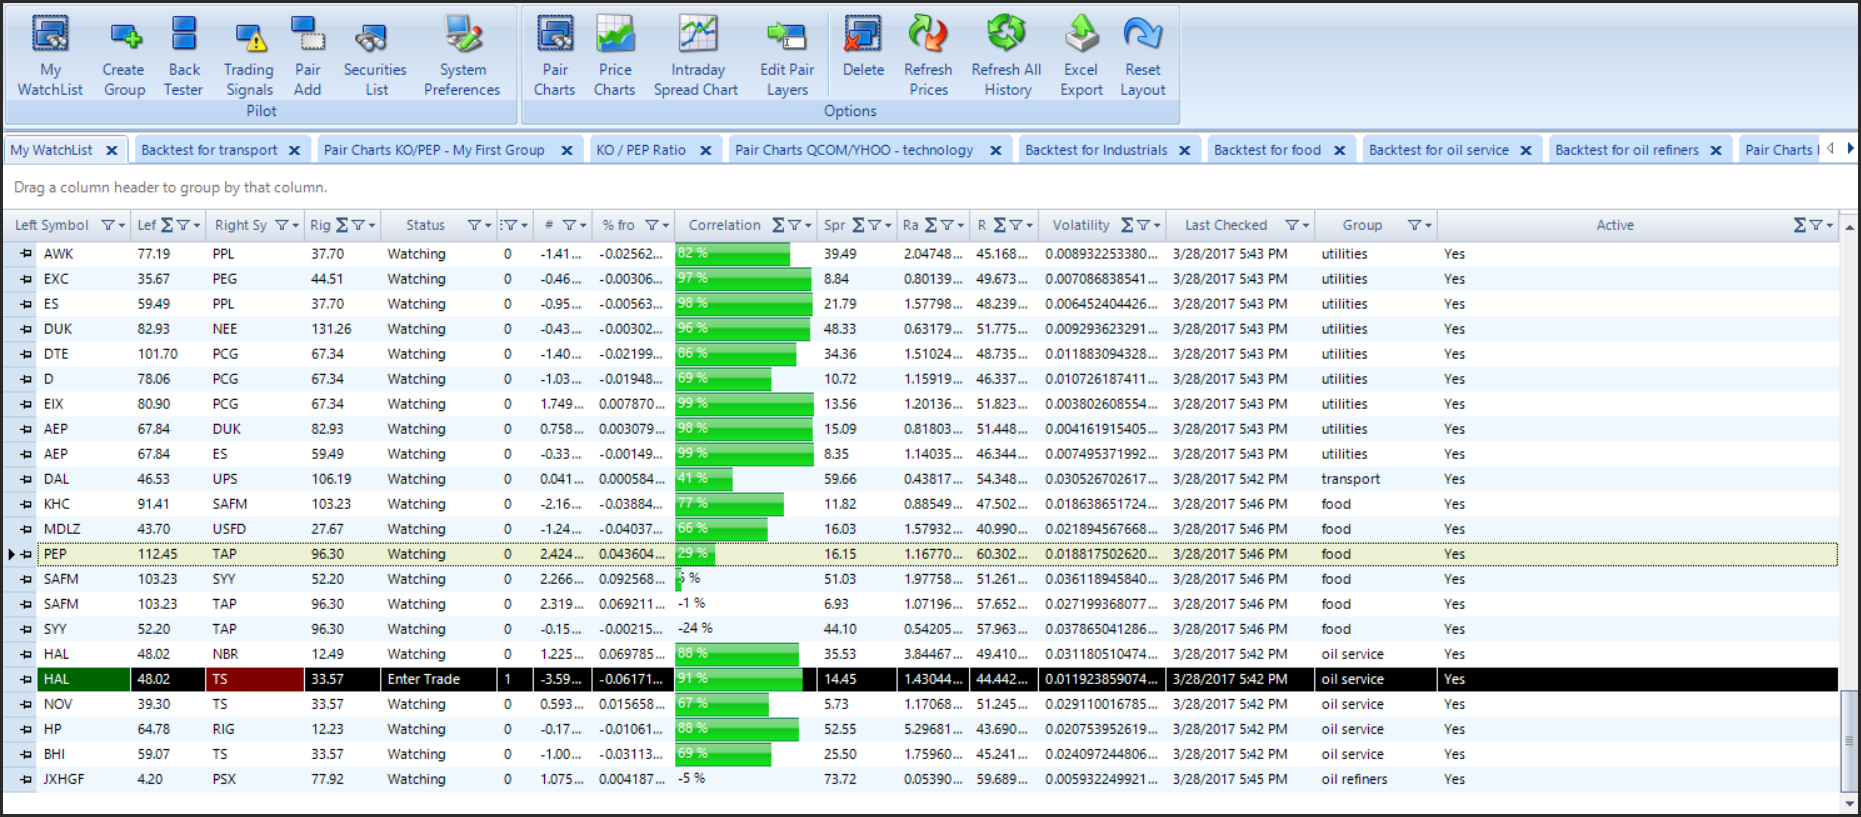
The backtest of the two stocks shows that over the past 3-years 7-signals were generated with a stretch of 2.7 standard deviations for an entry criteria,
… Read More →Why Pair Trading Can Perform Well in All Market Environments

Pair trading is a form of market neutral investing were the risks that you take are based on the performance of one stock relative to another. The benefits of this type of trading technique is that the returns you receive are uncorrelated to the performance of the broader markets, which means that you can generate robust results in all types of market environments.
Hedge funds are very active pair traders, and whether they call their strategy long/short or statistical arbitrage, what they are doing is purchasing one stock and simultaneously selling short another stock.
… Read More →15 Trading Tips for Trading Equities Pairs with Pairtrade Finder’s Stock Trading Software
Tip # 4 – Review The Correlation Chart
Investopedia defines “correlation” as a statistic that measures the degree to which two securities move in relation to each other. Correlations are used in advanced portfolio management. Correlation is computed into what is known as the correlation coefficient, which has value that must fall between -1 and 1.
A perfect positive correlation means that the correlation coefficient is exactly 1. This implies that as one security moves, either up or down, the other security moves in lockstep, in the same direction. A perfect negative correlation means that two assets move in opposite directions,
… Read More →15 Trading Tips for Trading Equities Pairs with Pairtrade Finder’s Stock Trading Software
Tip # 3 – Analyze Your RSI Chart
Technical analyst J. Welles Wilder created the Relative Strength Index (RSI) as a tool to measure the strength or weakness of the closing price series of a security over time. It is a measure of both velocity (speed!) and magnitude (distance travelled) of price changes and can identify stocks that are either overbought or oversold.
The Relative Strength Index is calculated as RSI = 100 – 100/(1+RS). RS (Relative Strength) is usually calculated as the exponential moving average of daily gains/exponential moving average of daily losses during a defined time period.
… Read More →15 Trading Tips for Trading Equities Pairs with Pairtrade Finder’s Stock Trading Software
Tip #2 – Price Ratio Analysis
Pair trading often succeeds or fails based on price ratio analysis, which is the core of the system. The maths are simple: in two correlated stocks what is the ratio of stock A to stock B (price A/price B)? The closer the stocks are in price, the closer the ratio will be to 1. For example, if stock A is trading at $55/share and stock B is at $58/share, the price ratio is 0.95.
Watch For Changes in the Current of the Stream:

Correlated stocks,
… Read More →15 Trading Tips for Trading Equities Pairs with Pairtrade Finder’s Stock Trading Software
Tip #1 – Determine Why the Trade Signals for a Pair Trade Were Generated
So things are going well in your quest become a profitable equity pairs trader. As a result of following our 3-Hour, 11-Lecture Pair Trading Video Course, you have:
- Installed Pairtrade Finder v3.27 on your PC and ensured you have a clean internet connection to access Yahoo! Finance data and keep your My Watchlist pairs updated both EOD and intraday;
- Created groups of equities that are in the same or similar industries and sectors, have market capitalizations of at least $1 billion,
We will NEVER spam you (privacy)

Our Awards
Copyright © 2008-2026 Event Driven Investor Ltd