


Tip #2 – Price Ratio Analysis
Pair trading often succeeds or fails based on price ratio analysis, which is the core of the system. The maths are simple: in two correlated stocks what is the ratio of stock A to stock B (price A/price B)? The closer the stocks are in price, the closer the ratio will be to 1. For example, if stock A is trading at $55/share and stock B is at $58/share, the price ratio is 0.95.
Watch For Changes in the Current of the Stream:

Correlated stocks, and to a great extent co-integrated stocks, over time tend to move up and down together like two fish swimming side-by-side. That’s a logical outcome of the mathematical relationship, which reflects the fundamental reality. The same economic factors, such as regulatory environment, macroeconomic trends, overall customer demand etc. affect both stocks similarly. Using historical data and pair trading software, a trader can establish a solid baseline for analysis. The longer the trading history of the pair, the firmer the backtested trading parameters derived from past price ratio deviations may be.
A pair trader looks for significant changes in the price ratio of a given pair over a short time frame. Is stock A soaring or is it dropping? Has stock B split or announced an unexpected dividend? Something in the current has changed and the fish are no longer swimming side-by-side.
At-a-glance price ratio charts can be a call to action whether it is further research or a trade. If stock A has taken off on a new product announcement that fundamentally alters its value, it will not be time to enter a reversion-to-the-mean pair trade on the ratio. If stock B is dropping without any significant news, causing a spike above 2 standard deviations from the moving average of the price ratio, perhaps the time has come to trade the ratio back to the mean.
Further, the ideal price ratio chart has the ratio oversold or overbought before entering a pair trade, as can be measured by the Relative Strength Index (but that is for the next post, see Tip #3).
Invest in a software program that tracks your pairs and instantly generates price ratio charts, ratio RSIs, price ratio standard deviation charting and real-time alerts when the deviation in the ratio is something that demands your attention. Below is a screenshot from Pairtade Finder v3.27 showing a 365 day lookback analysis of a pair we might consider, Huntington Bancshares vs. Charles Schwab Corporation:
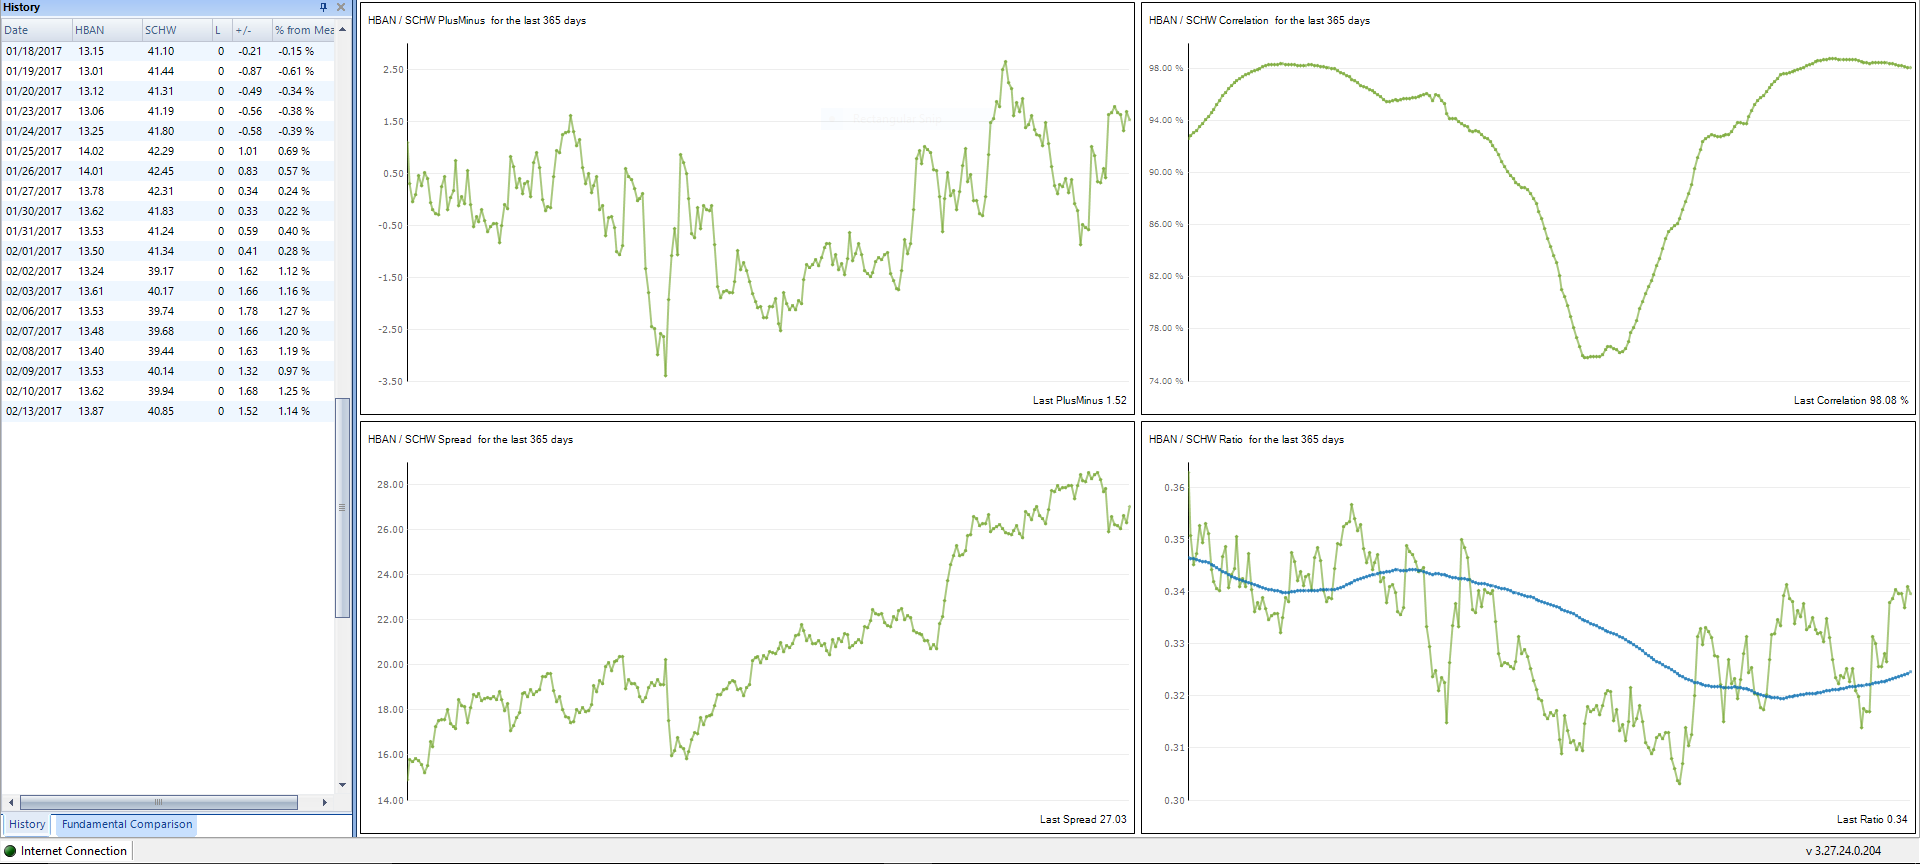
Is the spread trending too much? Is the price ratio chart ranging nicely over the year? Ideally we want to see a price ratio that is nicely ranging back and forth over a fairly flat moving average. We let you decide what looks good for you.
Here are the backtest results of this pair over the last three years using a 2.70 sd Entry and a 1.0 sd Exit. Only four trades…not much to go on, but does it work for you?
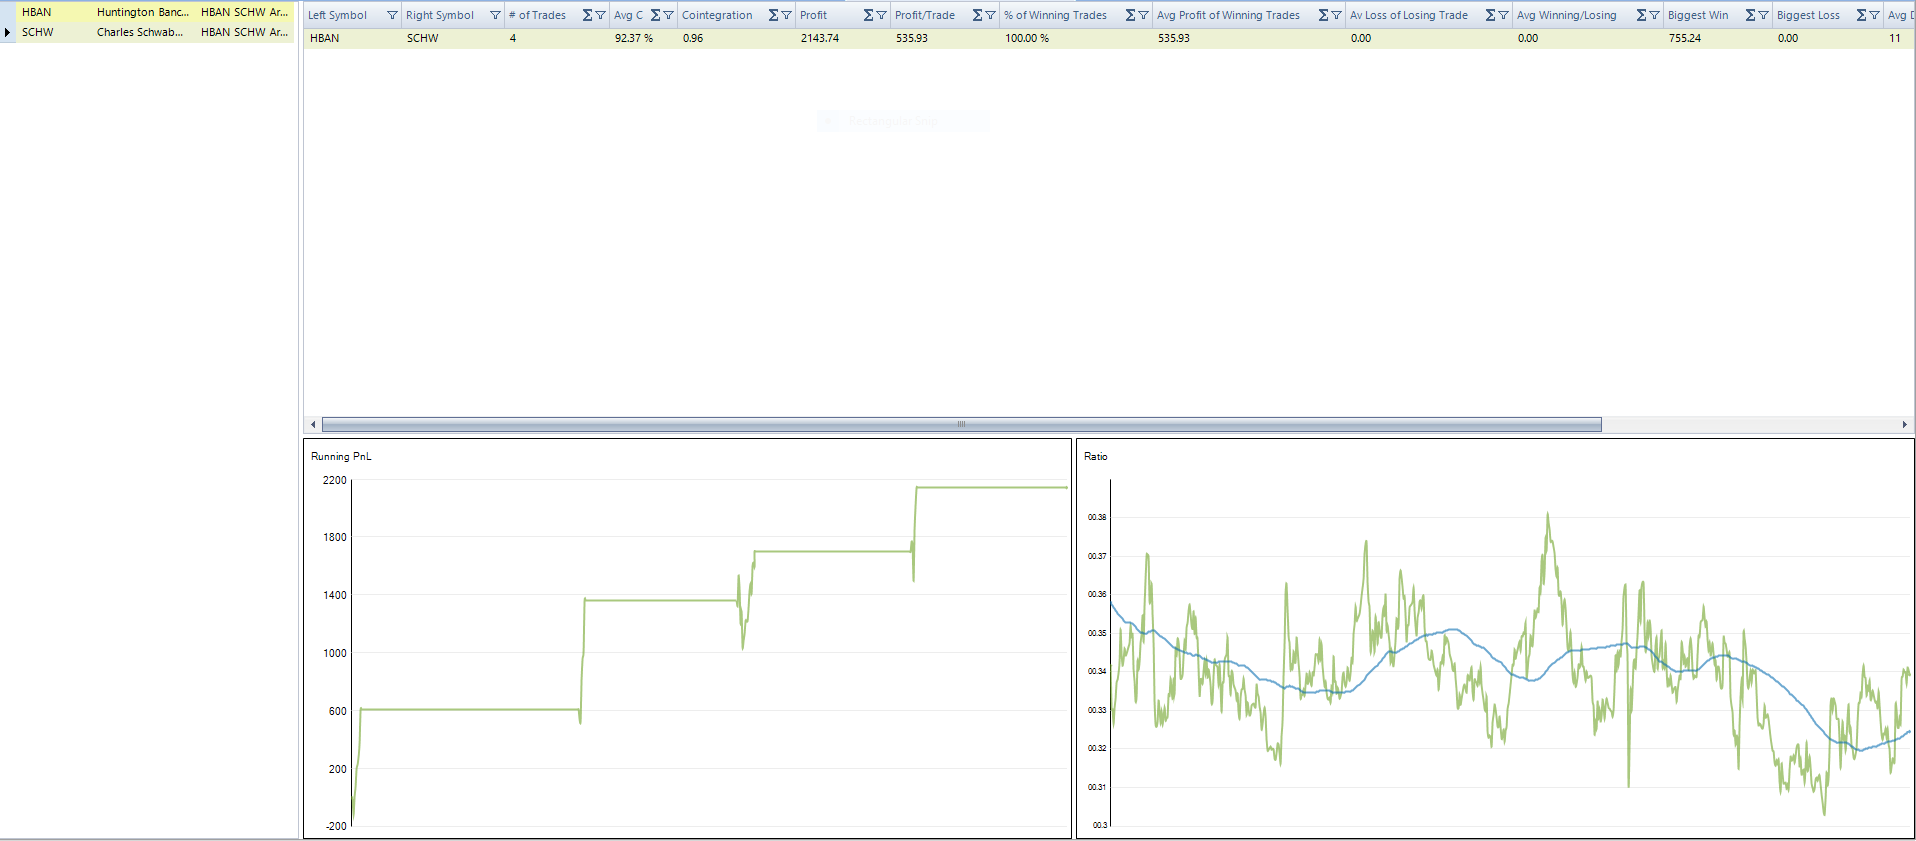
Let Pairtrade Finder do the heavy lifting, you decide the trades that look the best. And coming soon with Pairtrade Finder PRO, send any trade signals you deem as high probability automatically to your Interactive Brokers account with our new integrated greybox trading functionality.
Start a free 30-day trial of Pairtrade Finder and see what long/short trading of historically profitable stock pairs can do to bring you consistent profitability.
Wishing you consistently profitable trading.
Geoffrey Hossie
Pairtrade Finder
