


KB Financial Group vs. Sumitomo Mitsui Financial Group
$926 in 5 Market Days ($10,000/leg)
23% Return on Margin (5:1 CFD leverage)
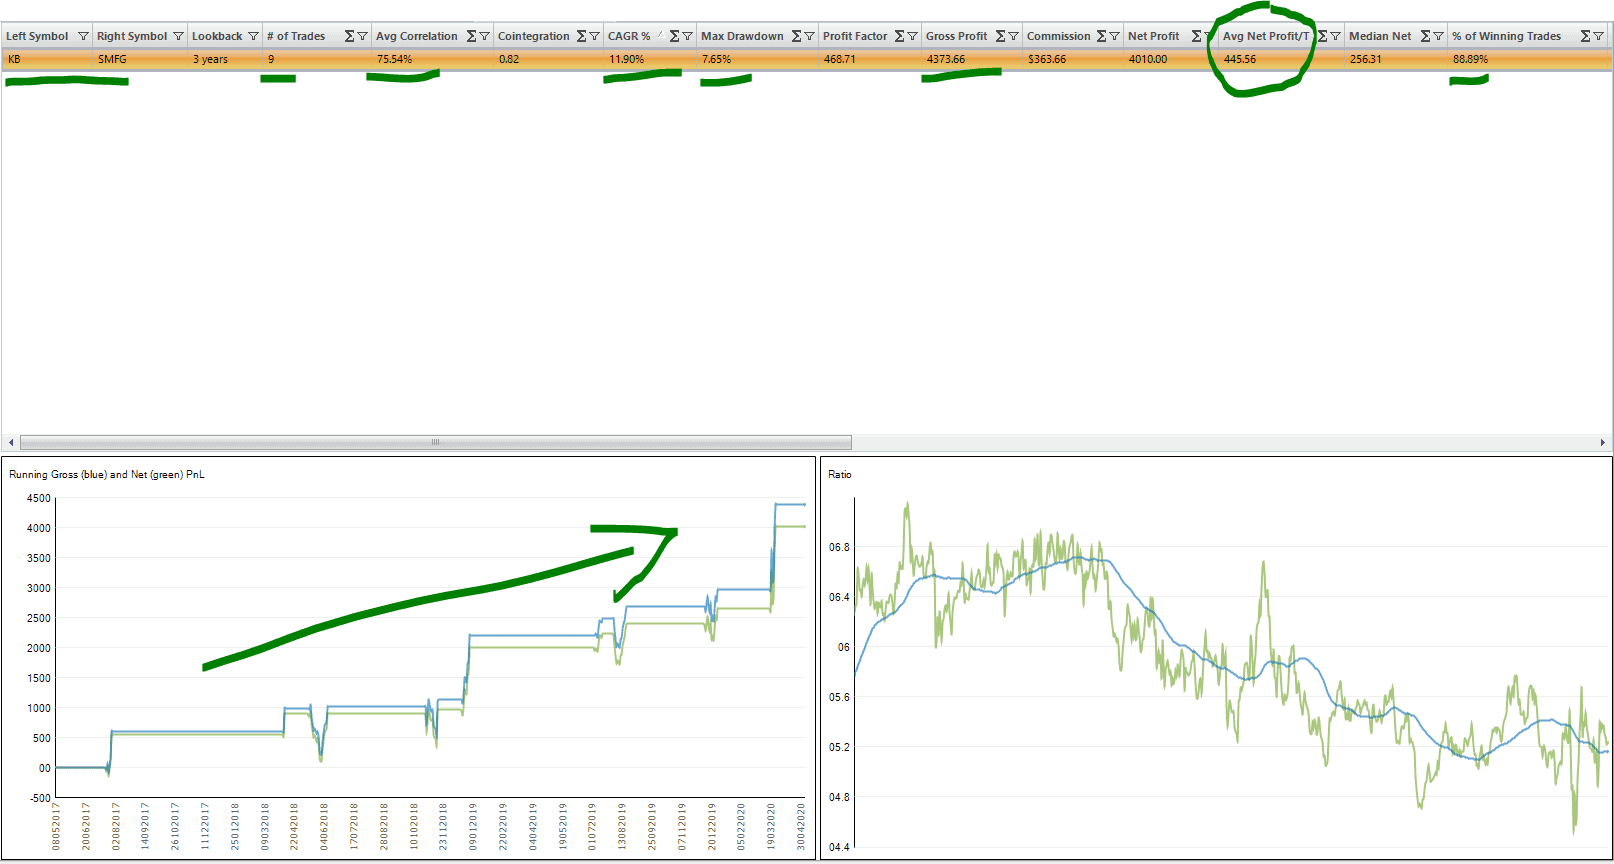
Backtest Results of KB/SMFG One of Our Best Stock Pairs:
In backtesting over the three years prior to 1 April 2020, correlated stock pair KB/SMFG delivered 9 closed trades, an 89% win rate, an average net profit per trade of $446, and over $4,300 in total profits:
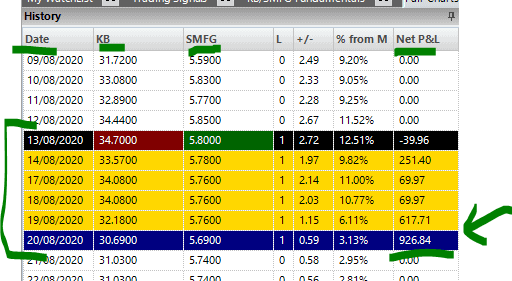
Actual Trading Result
In actual trading, KB/SMFG called an Entry Signal on 13 August 2020 at a +2.72sd. The trade exited on 20 August 2020, five market days later at a +0.59sd, delivering a $927 Net Profit and a 23% return on margin! (assumes $10,000/leg trade size and 5:1 CFD margin).
Get Pair Trading Help with PairTrade Finder®’s Best Stock Pairs: Our Top 30 U.S. Equities Pairs
We analyse over 1,800 U.S. equities to find you the best stock pairs for you to trade. Now that is pair trading help! We update this analysis on a more or less quarterly basis to ensure these pairs stay fresh and their correlations and cointegrations strong to offer you the highest-probability setups. All pairs must meet strict profitability and robustness measures as follows:
- USA Exchange-traded (NYSE/NASDAQ/AMEX): > than $2 bln mkt cap (most much larger), > $2 million/day of average daily traded volume($), easy-to-borrow
- Similar fundamentals: same national market, same sector, usually same industry sub group. Preference for beta-similar, market-cap-similar pairs
- Backtested with a 2.5 standard deviation Entry Stretch, 0.8 standard deviation Exit Stretch on the Core Ratio of the pair’s share prices
- Three-year backtest lookback period, 63 day (one trading quarter) Standard Deviation, Ratio and Stretch lookback settings
- COINTEGRATION: We use the Augmented Dicky Fuller test for co-integration and select only pairs with a p-value of 0.10 or less over the 3 year period
- CORRELATION: of minimum 50%, preferably higher. Lower correlation can be tolerated if pair is strongly cointegrated and scores highly on all other criteria
- Minimum Average Profit per Trade of $300, preferably $400+.
- Compound Annual Growth Rate of Net Profits for each pair preferably in excess of Maximum Drawdown % i.e. positive reward/risk. Maximum historic drawdown < 20%, preferably <15% (before leverage)
- Win Rate at least 70%
- Maximum Days in Trade of 40 days. This setting represents our time stop. Average days per trade is around 12-15 days
Subscribe today and receive immediate stock pair trading signals straight to your email as they arise. www.pairtradefinder.com
Happy trading.
Geoff, Paul & The PairTrade Finder® Team
NB: The Top 30 example equities pairs in PairTrade Finder® PRO and the trading signals generated therefrom are provided for informational and educational purposes only. They should not be construed as personalised investment advice. It should not be assumed that trading using the parameters demonstrated by the Software will be profitable and will not result in losses. Please see our full Terms & Disclaimer here.
